
Papertrade: The House Always Wins
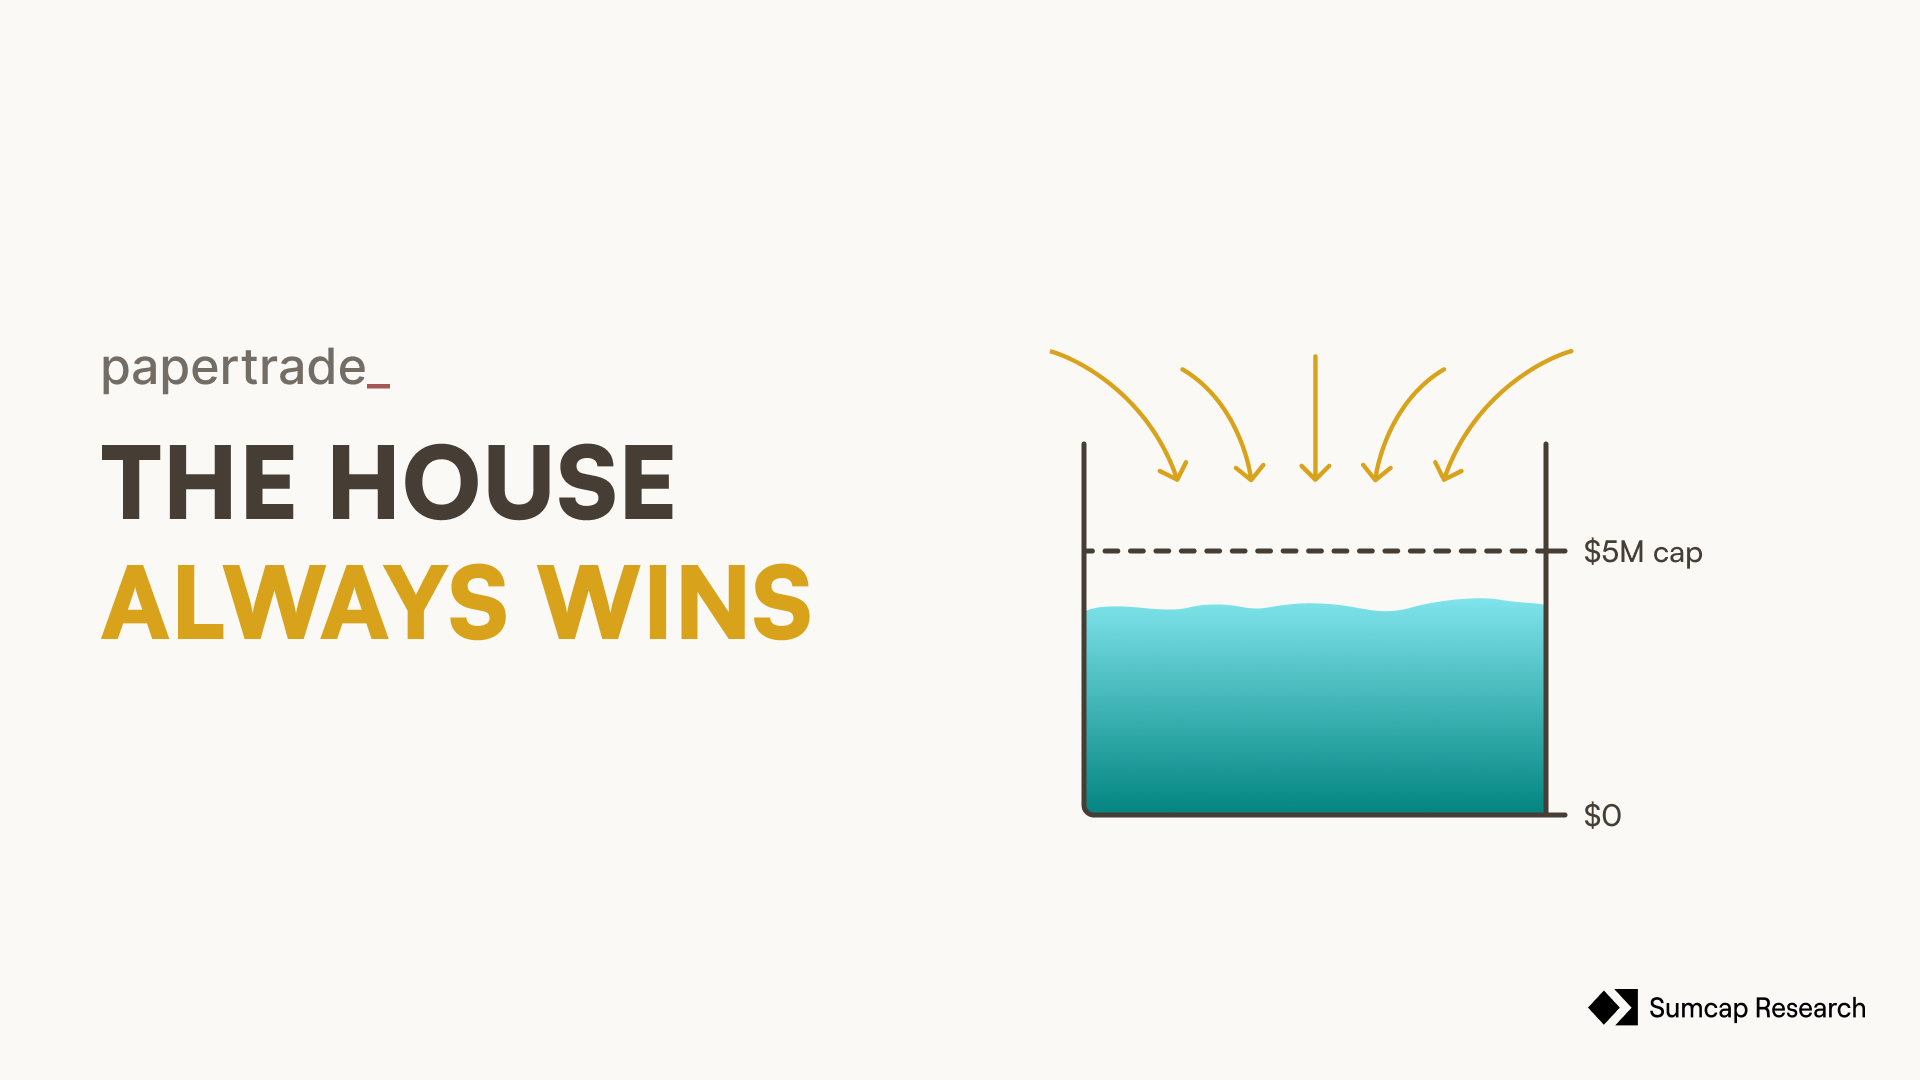
Can a pool funded by nothing but the losses of the people trading against it survive the people trading against it? We simulated it 608 times to find out.
1. Introduction
Papertrade is a synthetic perpetual protocol built on HyperEVM, offering up to 1000x leverage with no slippage. This is possible because trades on Papertrade are not matched against other users; instead, every position is a synthetic swap between the trader and the LP, which starts at $0 and is funded entirely by trading activity.
When a user opens a position, the contract reads Hyperliquid's Best Bid and Offer (BBO) mid price through a precompile and locks that price as the entry. When the position is closed, the contract reads the BBO mid again in the next block and settles the resulting PnL directly against the LP. As no perpetual contract is opened, traders pay no funding; and because execution happens at the BBO mid rather than through an order book, there is no slippage regardless of trade size.
2. How Papertrade Works
2.1 The synthetic trade
On most perpetual trading venues, your counterparty is another trader (an order book). On Papertrade, your counterparty is always the LP and your trades are always synthetic.
If you close at a loss your lost margin moves to the LP, but if you close at a profit, the protocol applies what it calls asymmetric impact to your realised gain. The asymmetric impact is a smooth scale factor applied on top of the raw gain. This scale factor is inversely proportional to the move a trader captures: the bigger the swing, the smaller the haircut - which incentivises users to chase large moves.
The formula for a winning close is:
\[\begin{aligned}\text{adjustedPnl} &= \text{rawPnl} \times \text{scale} \\[1em]\text{scale} &= \frac{1 - \text{baseRate}}{1 + \text{term1} + \text{term2}} \\[1em]\text{term1} &= \frac{1}{\text{move} \times \text{rateMultiplier}} \\[1em]\text{term2} &= \frac{\text{referenceNotional}}{\text{move} \times \text{positionMultiplier}} \\[1em]\text{move} &= \frac{\left|\text{exitPrice} - \text{entryPrice}\right|}{\text{entryPrice}}\end{aligned}\]
A deadband of 0.2bps is subtracted from move before anything else, the reduced move both feeds the scale factor and sets the gain that scale factor is applied to, so adjustedPnl is zero for any winning close below that threshold.
baseRate, rateMultiplier, positionMultiplier, and referenceNotional are per-instrument governance parameters. As move increases, both term1 and term2 decrease, and the denominator approaches 1, meaning the trader keeps a larger share of their rawPnl. As move approaches zero, term1 and term2 tend to infinity and the adjustedPnl collapses to zero.
There is a second, subtler reason for this PnL curve shape. Because the haircut is steepest on the smallest moves, an attacker who briefly distorts the order book to engineer a small profitable close finds much of the gain consumed by the steepness of the curve. Beneath the curve sits the 0.2bps deadband, half the CLOB spread.
2.2 The queue
Now the obvious problem. Since the LP starts at $0, what happens when the very first trade is a winner?
If a trader wins and the LP cannot cover the full payout (margin plus winnings), the margin is always returned, and the remaining winnings (after the asymmetric impact) are placed in a First In First Out (FIFO) queue. When the LP later receives money (from a loss or a liquidation), that money pays down the queue in order of arrival before it is allowed to grow the LP balance.
As long as traders keep coming back (and losing, filling up the LP), the protocol can keep paying winning trades.
The main concern is that a rational trader won't willingly trade against a pool that might not pay them, or an empty one. To counteract that, Papertrade pays its losing traders in $PAPER. Every dollar that moves into the LP from a loss or a liquidation mints the token. The rate is highest in the pool's earliest and most fragile days and decays as the LP grows, so the earliest losers mint far more per dollar than anyone who arrives later.

Once the LP fills its $5M cap, further trader losses route to $PAPER stakers rather than growing the pool. That is all the token detail this piece needs. What stakers actually earn on that stream, how the yield compares to the token's inflation, and whether holding $PAPER is economically rational, are the subject of a separate follow-up. Here the question is narrower, whether the pool itself survives.
3. Research Objective
While the protocol's economic architecture functions cohesively in theory, its long-term operational viability hinges on a critical, path-dependent assumption, that aggregate trader losses consistently outpace payouts to profitable counterparties.
Consequently, the central focus of this research is the structural sustainability of this mechanism. The underlying incentives exhibit intense reflexivity. The economic justification for minting $PAPER is entirely contingent upon LP solvency, yet the pool's solvency is inherently dependent on continuous trader liquidations.
We formally evaluate whether the LP can maintain structural solvency when funded exclusively by counterparty losses and bootstrapped entirely by token emissions, in a 1000x leverage environment. Whether the token that funds this is worth holding - how its yield compares to its inflation, and whether the incentive to lose survives as emission decays - is a separate question we take up in a follow-up.
Here the question is narrower: does the pool itself survive.
To stress-test the architecture, we replayed 3.6 million real Hyperliquid trades through Papertrade's rules, parameterised with Rollbit's published impact curve, across 608 scenarios, sweeping traction, launch timing, auto-deleveraging treatment, and volume decay.
4. Data Acquisition and Leverage Reconstruction
The empirical data of this analysis rests on three distinct data streams extracted from Hyperliquid: historical state snapshots, discrete trade execution fills from Hydromancer, and per-position leverage records from the HyperTracker API.
The snapshot dataset spans approximately 238 days but contains a 53-day gap extending from late October to mid-December 2025. Because of that, trade execution fills were ingested to capture every BTC and ETH transaction from August 1, 2025 onward, ensuring continuity. Additionally, HyperTracker per-position leverage data was obtained to provide ground-truth leverage readings independent of the snapshot schedule.
Integrating these three data types required reconciling distinct structural limitations:
- State Snapshots. Provided a direct reading of account leverage but were limited to daily frequency. Consequently, intraday positions opened and closed between snapshots were omitted.
- Execution Fills. Provided a high-fidelity, comprehensive ledger of all Hyperliquid activity, but lacked explicit metadata regarding leverage.
- HyperTracker Positions. Provided per-position leverage at the time of opening. BTC coverage is complete across the full simulation window (August 2025 to May 2026); ETH coverage extends from August to December 2025, with the remaining period relying on drawdown-bound classification and snapshots.
5. Assumptions
- We keep only the trades we could confirm ran at maximum leverage (40x on BTC, 25x on ETH), on the premise that Paper's 1000x venue draws the high-risk crowd that Hyperliquid's serious traders are not part of. This is the study's load-bearing assumption: it selects the population most likely to lose, and therefore most likely to keep the LP solvent, so we read the full-grid solvency result as conditional on it and return to how much it depends on the analogue in Limitations.
- Hyperliquid imposes no maximum notional per trade; Papertrade caps opening notional at $10M. We rescale the notional distribution linearly so its 99.9th percentile maps to the cap, then clamp the residual tail at $10M - preserving the shape of the size distribution below the cap while respecting the protocol's ceiling.
- We model four levels of traction (25%, 50%, 75%, 100% of flow) by random subsampling, so lower flow is a random thinning of the same population with composition held fixed. A smaller or newer venue might draw a different mix, but absent data on what that mix would be, neutral subsampling is the conservative choice and preserves the size distribution at every level.
- Every protocol parameter in the simulation - leverage, caps, the emission schedule, and all four impact-curve knobs - is taken from a published configuration and held fixed. The impact-curve knobs are Rollbit's, since Papertrade's own calibration is not public, referenceNotional differs between the two protocols as in Rollbit's formula referenceNotional is the real notional of the position, whereas Papertrade holds it fixed. We use $100,000 throughout.
- We model BTC and ETH only, and treat the Hyperliquid prices in our data as the prices Paper would settle against - assuming the spread between a fill and the BBO mid, and the one-block lag between Paper's entry and exit reads, are negligible against the large moves that dominate this dataset.
- We model no trading fee or gas cost beyond the asymmetric-impact haircut, and treat a position as liquidated the moment its worst adverse move reaches the 5bps tolerance. Both choices are conservative for the LP: ignoring fees understates protocol income, and the liquidation mapping is, if anything, generous to the trader.
6. Limitations
Once-daily snapshots miss intraday positions. We argue these are negligible for this purpose, but it is an assumption, not a measurement.
Leverage reconstructed from fills is imprecise, particularly for cross-margin positions in the 53-day gap.
Behavioural analogue, not the real population. Max-leverage Hyperliquid traders are a proxy for Papertrade degens. Papertrade's own incentives (minting $PAPER on losses) would likely shift behaviour further toward risk than the source data shows.
No reflexive $PAPER price feedback. The simulation models the LP and emission mechanics, not the market price of $PAPER.
OI safety caps assumed non-binding. The $10M notional cap is enforced; the separate OI safety caps are assumed not to have bound in the simulated window.
Parameters are governance-adjustable. All results hold for the deployed configuration. The impact-curve knobs are per-instrument governance parameters and could be retuned after launch.
7. Methodology
7.1 What we simulated
We implemented Papertrade's complete settlement mechanism and pushed all 3.6M trades through it in chronological order, day by day, from day 0 to day 289. The mechanics are exactly as described above under How Papertrade works. This section covers the protocol parameters, what the deployed impact curve actually does to a winning trade, and the modelling assumptions we layered on top.
7.2 The parameters
Every number in the settlement mechanics is held fixed across the whole grid. All of them are Papertrade's own published configuration, except the four impact-curve knobs: Papertrade has not published its calibration, so baseRate, rateMultiplier and positionMultiplier are Rollbit's published x1000 values. The fourth, referenceNotional, has no Rollbit constant to borrow as Rollbit uses the position's real notional where Papertrade holds it fixed, to solve this, we use a $100K stand-in described in How Papertrade works.
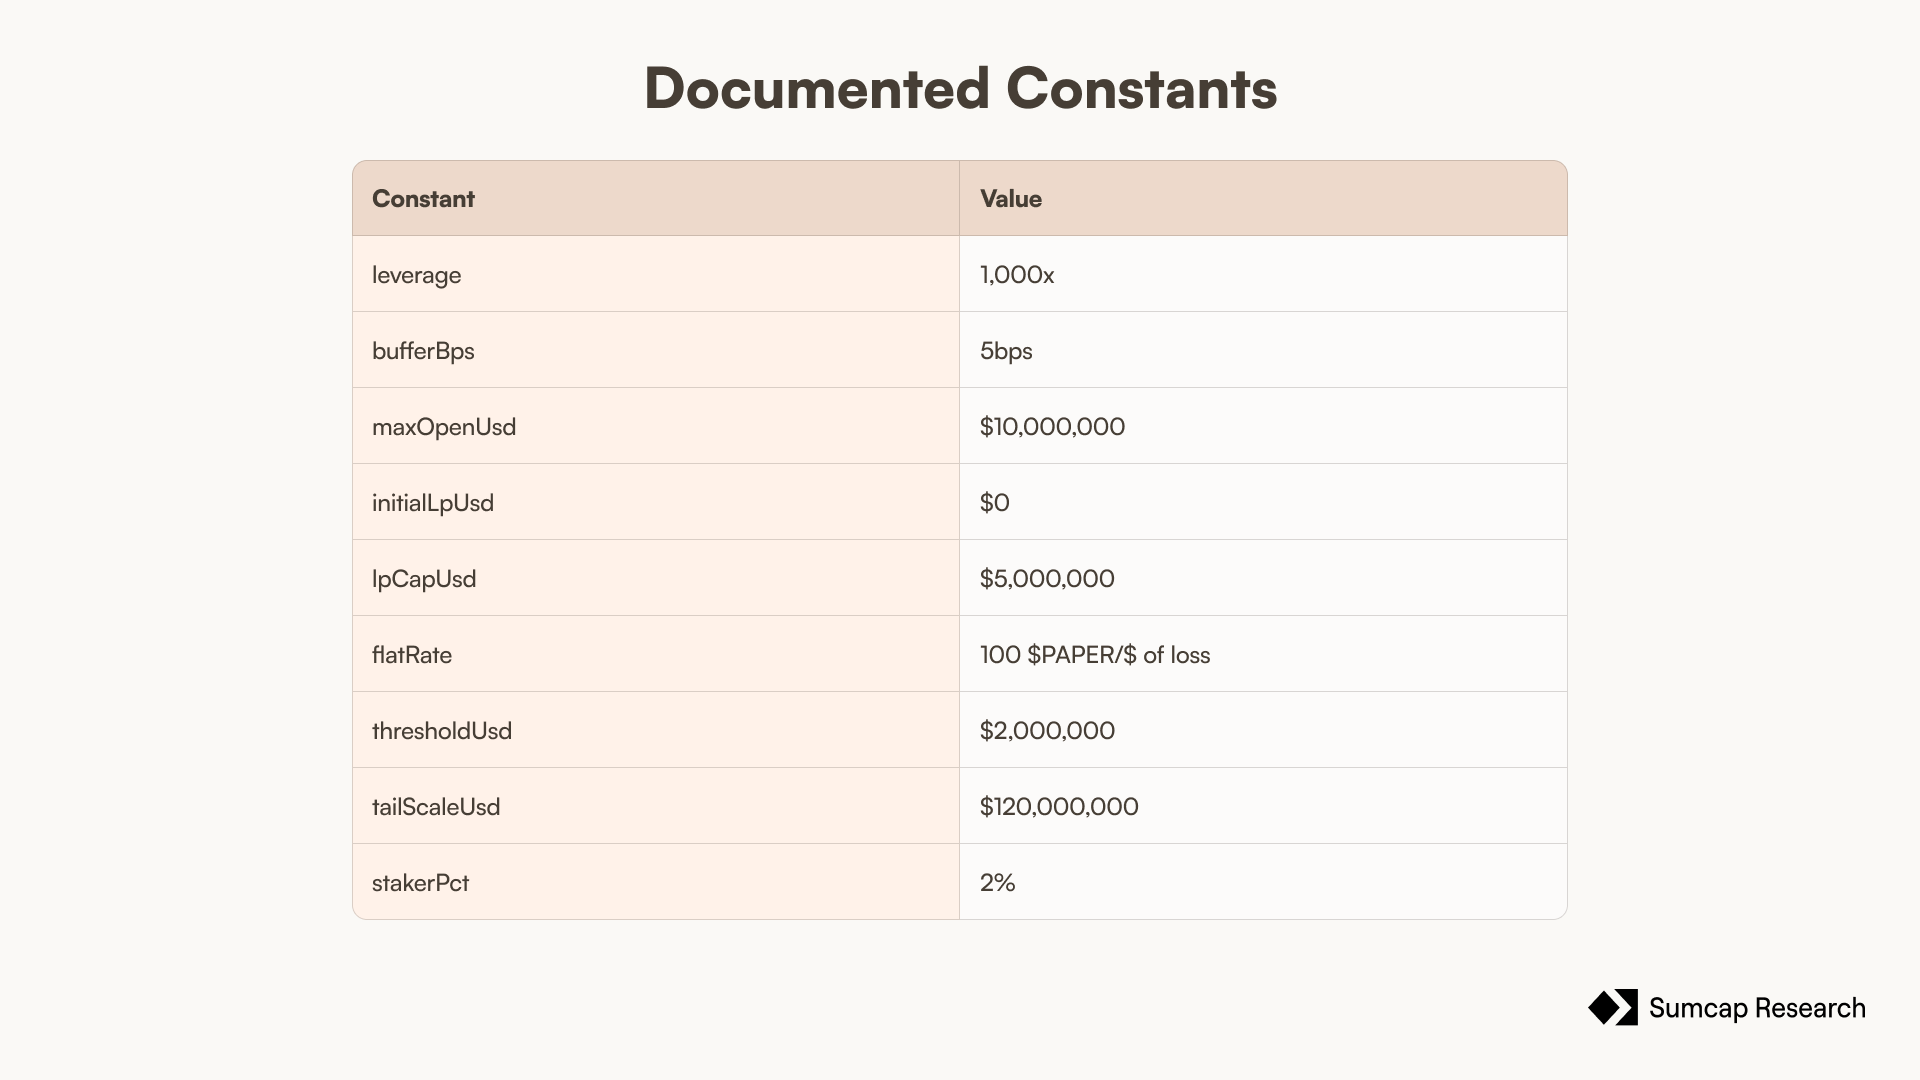
A liquidation threshold of 5bps means a position is treated as liquidated once its worst adverse move reaches 0.05%.
tailScaleUsd is the parameter that controls the shape of the emission decay, the larger it is, the more slowly minting ratchets down once the LP clears $2M.
The protocol fee is the slice of each dollar of protocol income peeled off while the LP is under $5M, split evenly between $PAPER stakers and the frontend; once the cap is full the split flips to 99% stakers, 1% frontend.
7.3 What the curve actually does
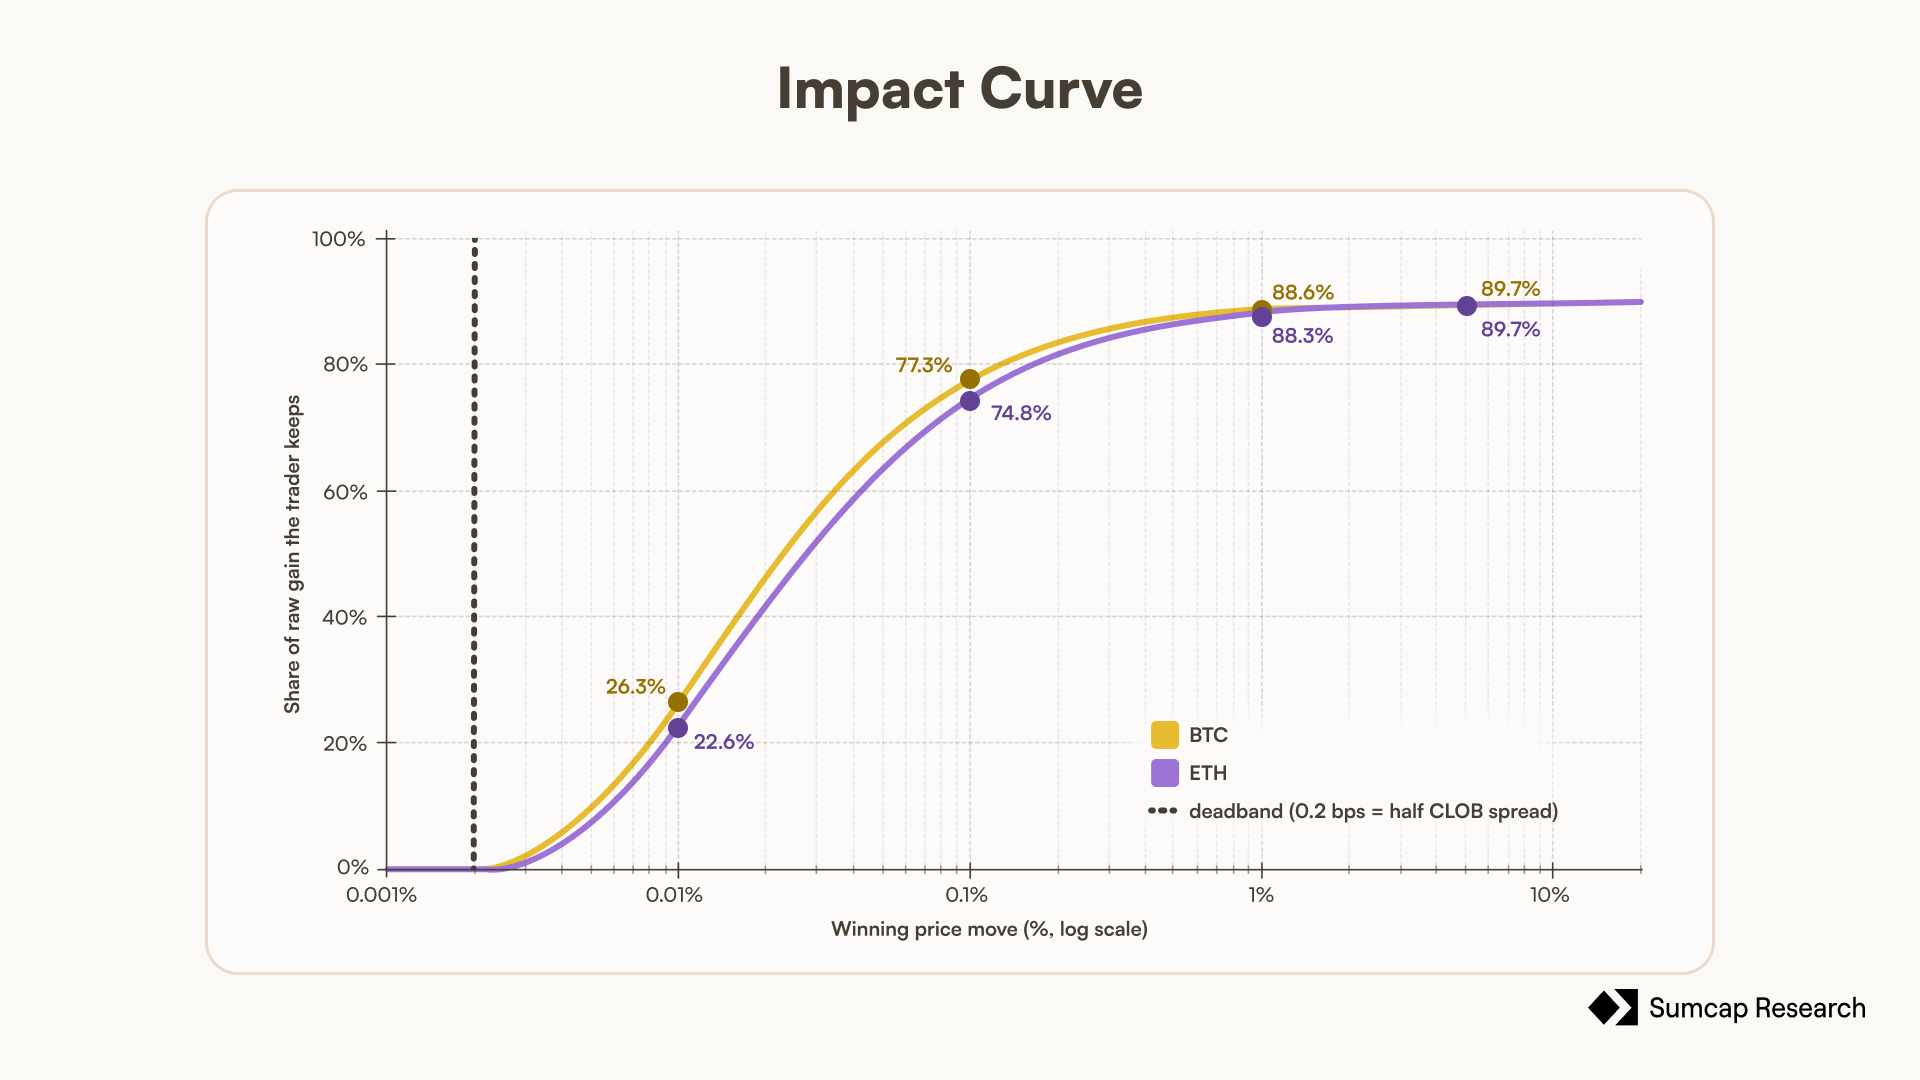
Two things follow directly from that table.
First, the haircut on any realistic win is small. The curve reaches its ceiling almost immediately: a BTC trader keeps a quarter of the raw gain from a move of 0.0095%, half from 0.0235%, and by 1% is already keeping 88.6% - close to the 90% the formula allows at the limit. Every move large enough to be worth taking sits on the flat part of the curve, so in practice a winning close on this venue surrenders about a tenth of its raw PnL in exchange for the extreme leverage. The curve bites only inside the first few thousandths of a percent, which is well below the 0.05% line at which the same position would already have been liquidated.
Second, the difference between the two assets is real but immaterial. Only the ratio referenceNotional / positionMultiplier enters term2, and ETH's ratio is exactly 1.5 times BTC's - but both ratios are small enough that term2 barely moves the denominator. At a 1% move a BTC winner keeps 88.6% and an ETH winner 88.3%. Whatever disadvantage the ETH max-leverage trader carries in our data comes from the size of their adverse moves, not from the curve.
The reason ETH is wiped more often than BTC is the size of the moves. The worst adverse move on a typical BTC max-leverage trade is around 0.22%, and on ETH around 0.41%, both far past the 0.05% liquidation line - BTC liquidates 80.1% of the time and pays off 11.2%; the remaining 8.7% closed under water without ever touching the 5bps line (8.0%) or settled at brake even. ETH liquidates 91.5% and pays off 6.7%, with 1.9% in that same residual, the smaller share precisely because ETH liquidates more.
Counting liquidations and partial losses together, 88.1% of BTC trades and 93.1% of ETH trades hand money to the LP.


7.4 Modelling choices
Flow fractions. Among our 3.6M trades we simulate four flow levels - 25%, 50%, 75%, 100% - by random sampling; see assumption 3.
Start days. As some windows are far more volatile than others, sweeping the start date isolates how much the verdict depends on the luck of when the protocol goes live, that's why we simulated 38 launch dates, one every 7 days.
ADL worst-case. As Papertrade doesn't have ADL but our data does, we run the grid with auto-deleveraging off and on. Off, trades are replayed as-is. On, we use real Hyperliquid ADL data and see what happens if all the trades that got auto-deleveraged closed at the tip of that day's wick (the most the trader's PnL could have reached on a given day). This is a deliberate worst case.
Emission-based volume. This is the one assumption that feeds the mechanism back into trader behaviour, and it deserves spelling out. The main reason to trade into this LP at all is the $PAPER you mint by losing; as the LP matures past $2M and emission decays, that incentive weakens, so we could expect the flow to contract over time.
The full simulation code is available here.
8. Results
8.1 The survival rate
Across the full grid of 608 scenarios, spanning every launch date, every flow level, both ADL modes, and both volume models, the pool ends solvent in 100% of runs - for the max-leverage cohort this study models, which is by construction the population most prone to the losses that feed the pool. Better than that, in 494 of the 608 (81.2%) the pool never has to queue a single winner, as the LP absorbs the early losses fast enough that there is usually cash on hand to pay whoever wins.
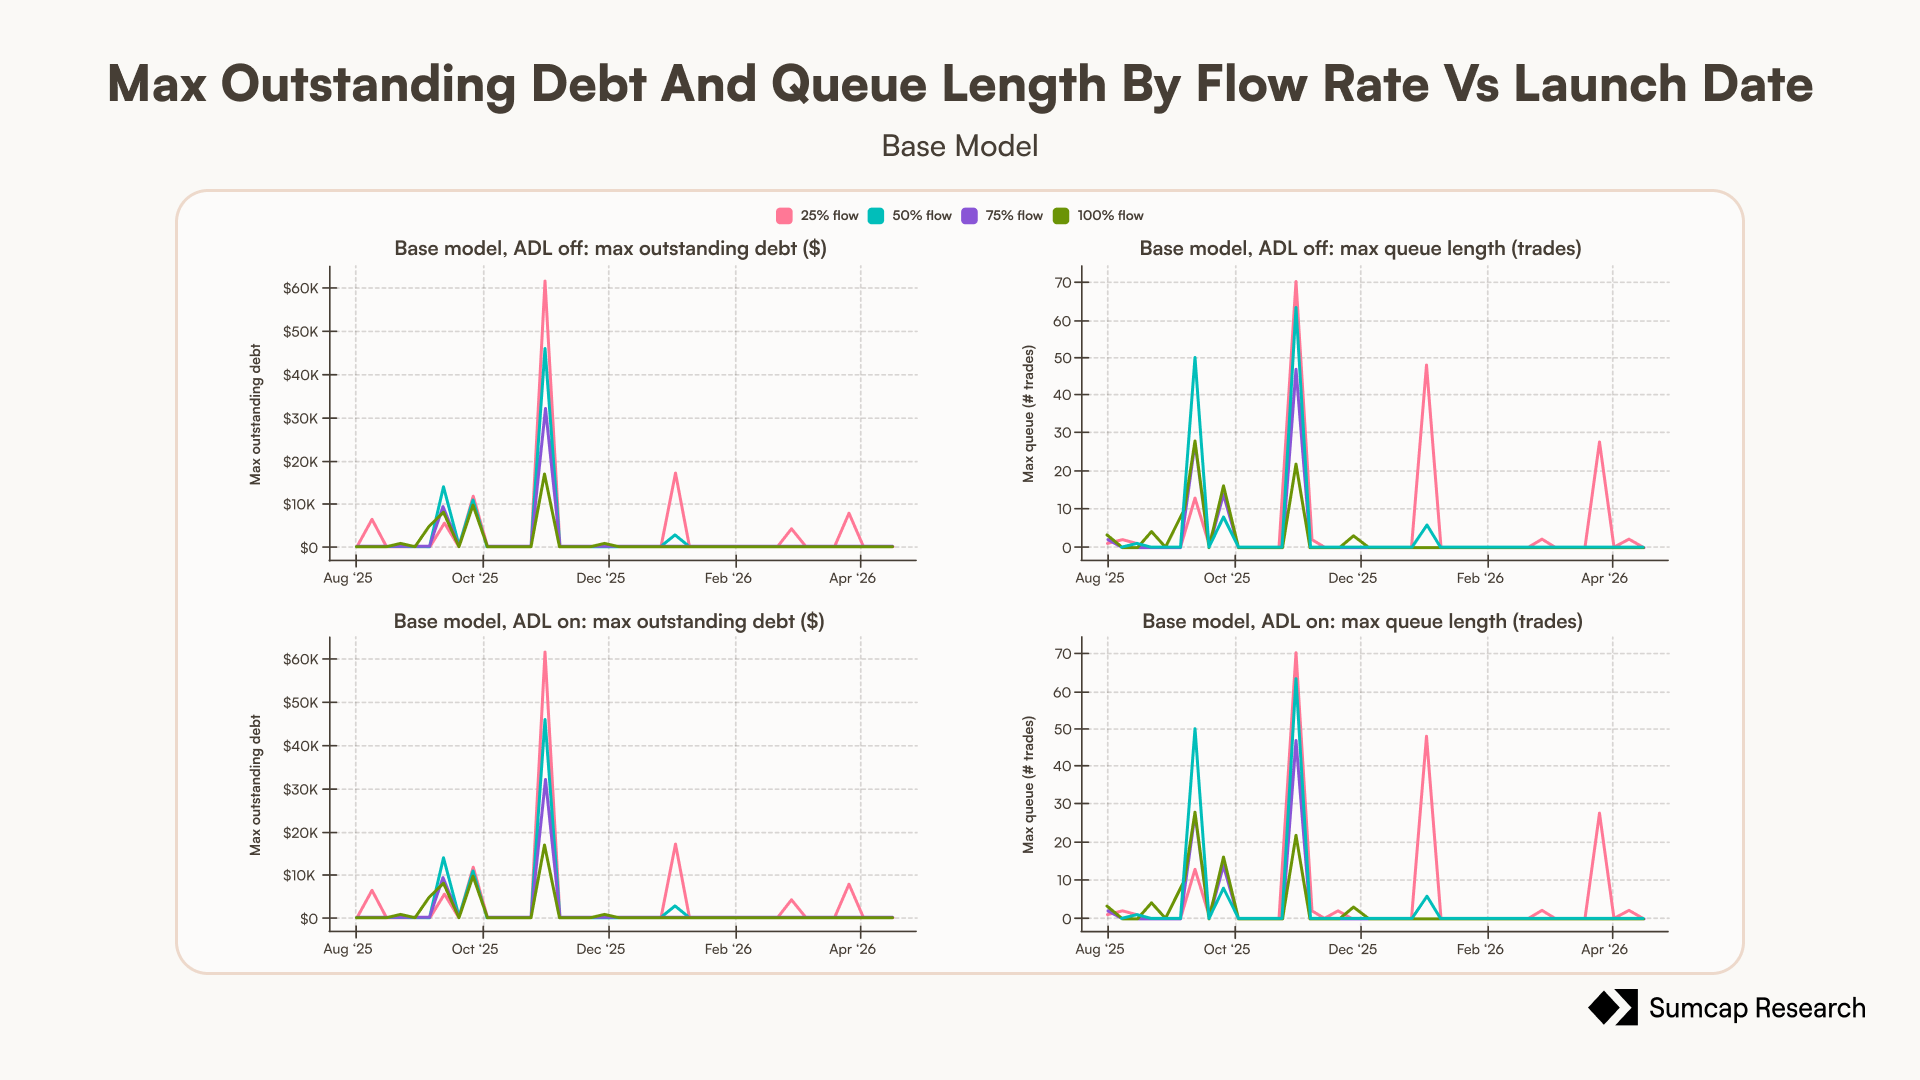
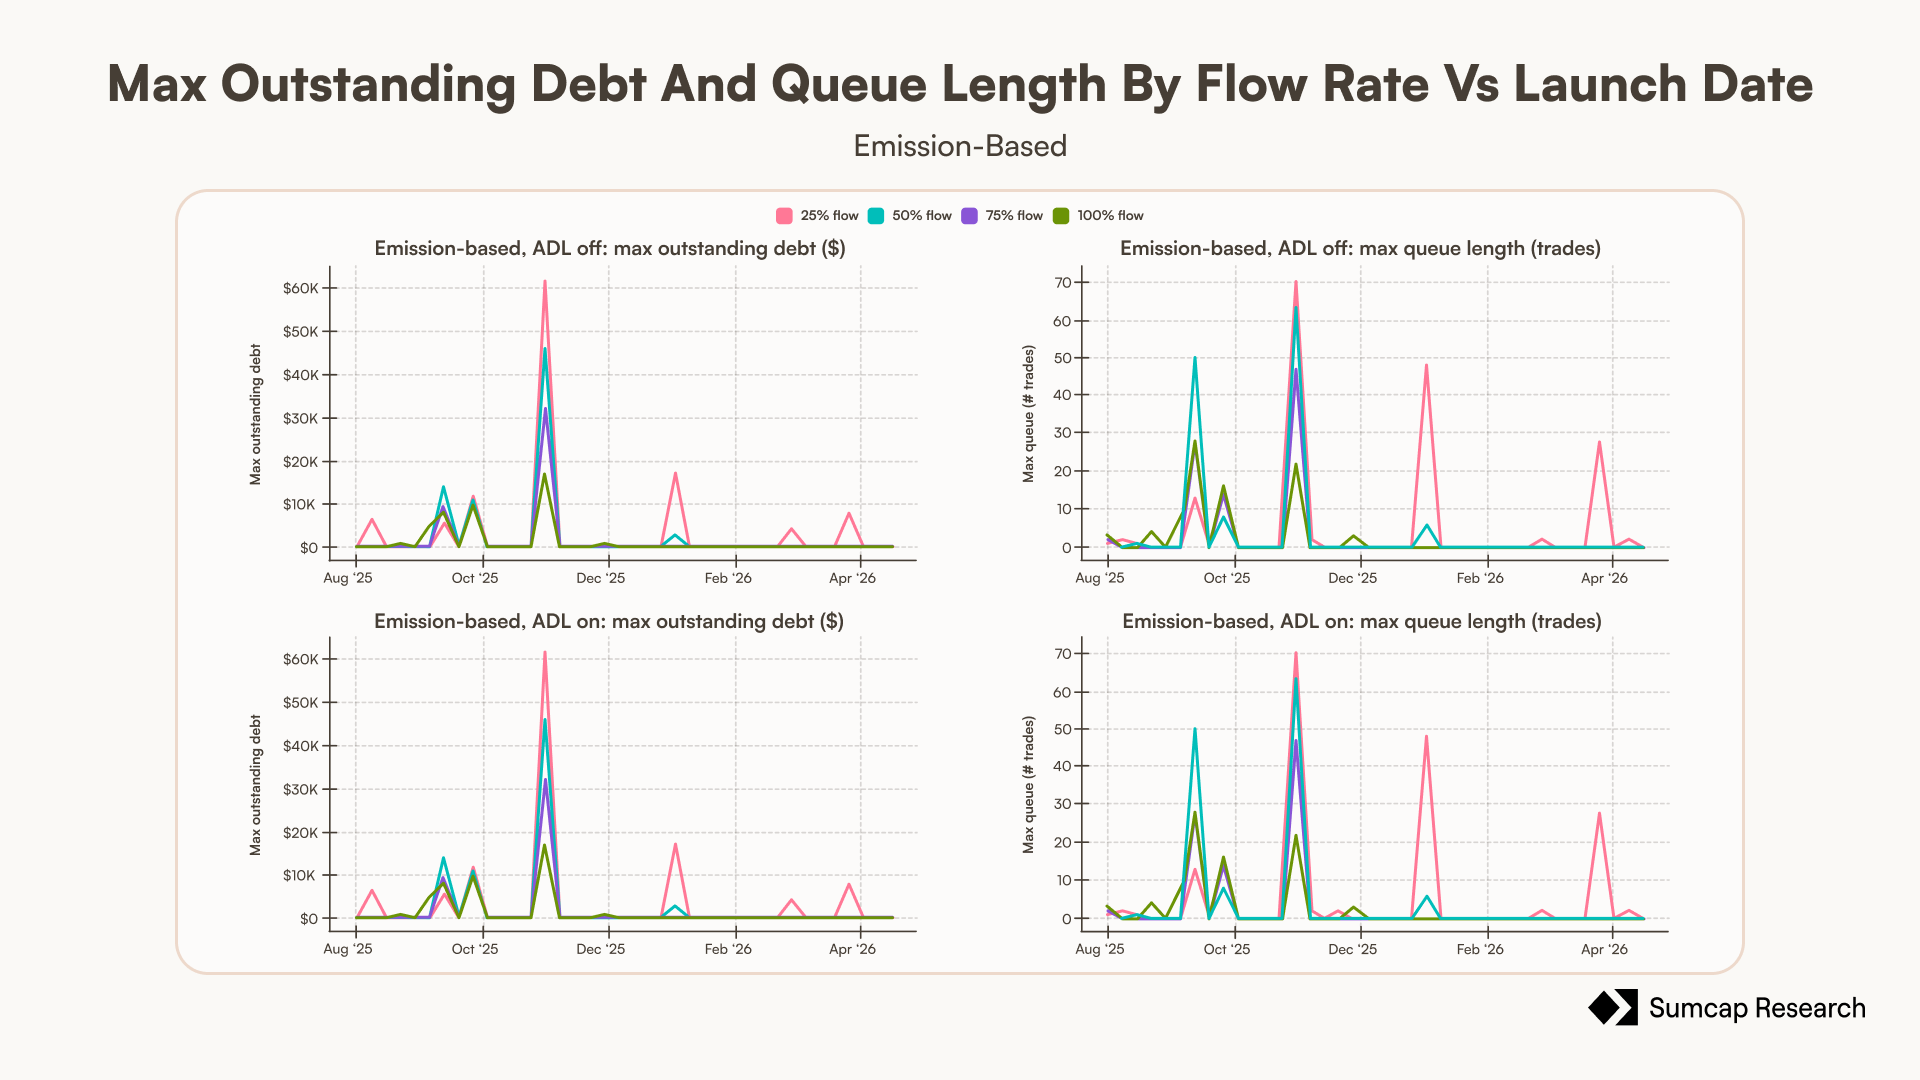
When the pool does fall short, the shortfall is small and instant. Across all 608 runs the largest single unpaid amount ever recorded is $61,974 and the queue never holds more than seventy trades at once; both records belong to the same run, a 25%-flow pool launched on day 91. No debt survives the day it is created, and every queued trade in that worst case was paid in full. The 114 debt events across the grid concentrate at the thinnest flow - forty-six at 25%, twenty-four at 50%, sixteen at 75% - but they do not disappear at full flow, where twenty-eight remain.
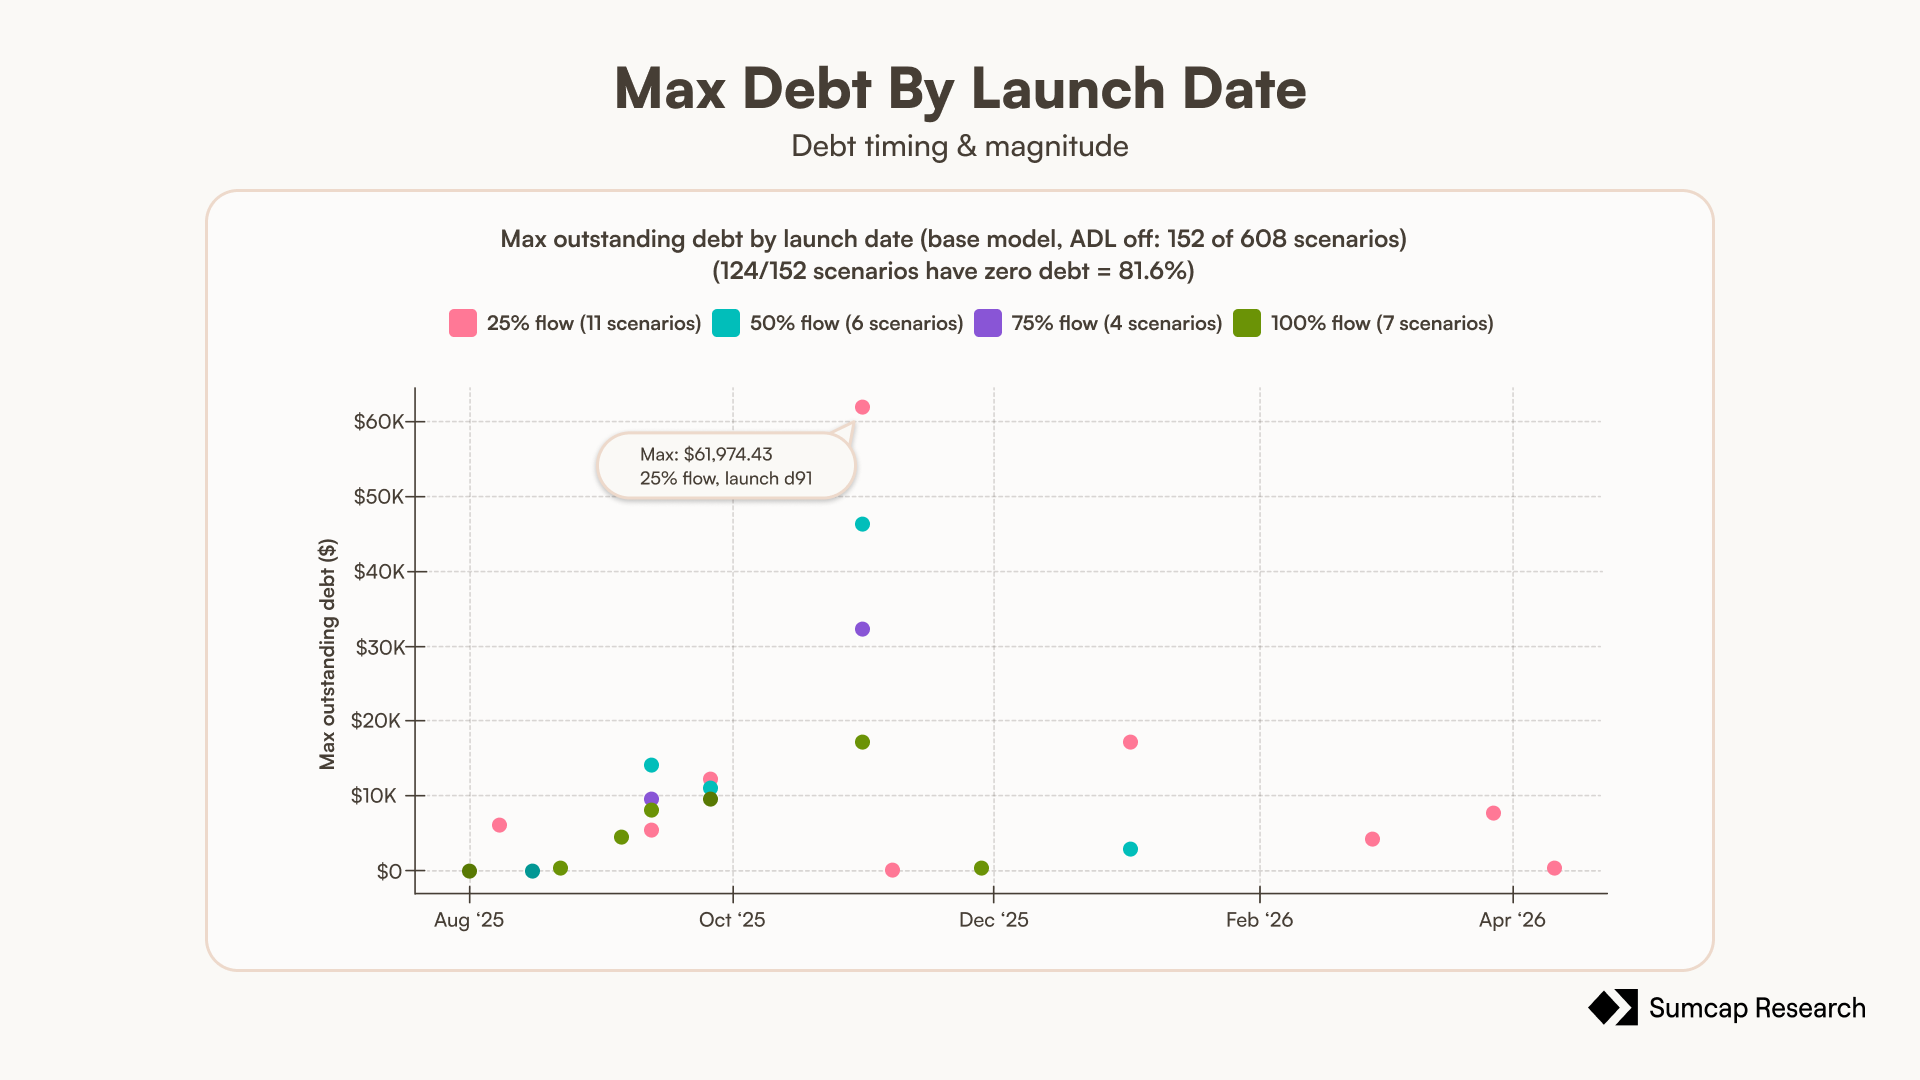
The reason debt is so rare is that the pool fills quickly. Starting from $0, launching on day 0 at full flow, the LP hits $5M in about 5 days; at a quarter of Hyperliquid's real max-leverage volume it takes roughly 14 days. Flow is the only thing that materially changes the speed, more traders means a faster fill.

Launch timing matters only at the edges, as we see below. Pools that go live into the most volatile stretch of the sample, late 2025, take a little longer to fill and account for almost all of the rare debt events, but they still reach the cap and still end solvent. The only scenarios that never reach $5M are a single launch date, day 259 at 25% flow, which appears once in each of the four grid cells and whose 290-day window simply ends before the pool gets there. At that flow the fill takes weeks rather than days - the slowest pool that does reach the cap needs 36 - and even those four finish with zero residual debt.

Turning on real Hyperliquid auto-deleveraging, our deliberately worst-case stress, leaves LP recovery visually unchanged as the pool is fed fast enough to absorb even the inflated winners. On the other hand, the pessimistic flow model, where trader volume contracts in lockstep with the fading $PAPER incentive, shrinks the entire economy around the pool (less volume, less $PAPER, smaller trader losses) without threatening survival. The LP still fills to $5M from every launch date but the last, which runs out of data.
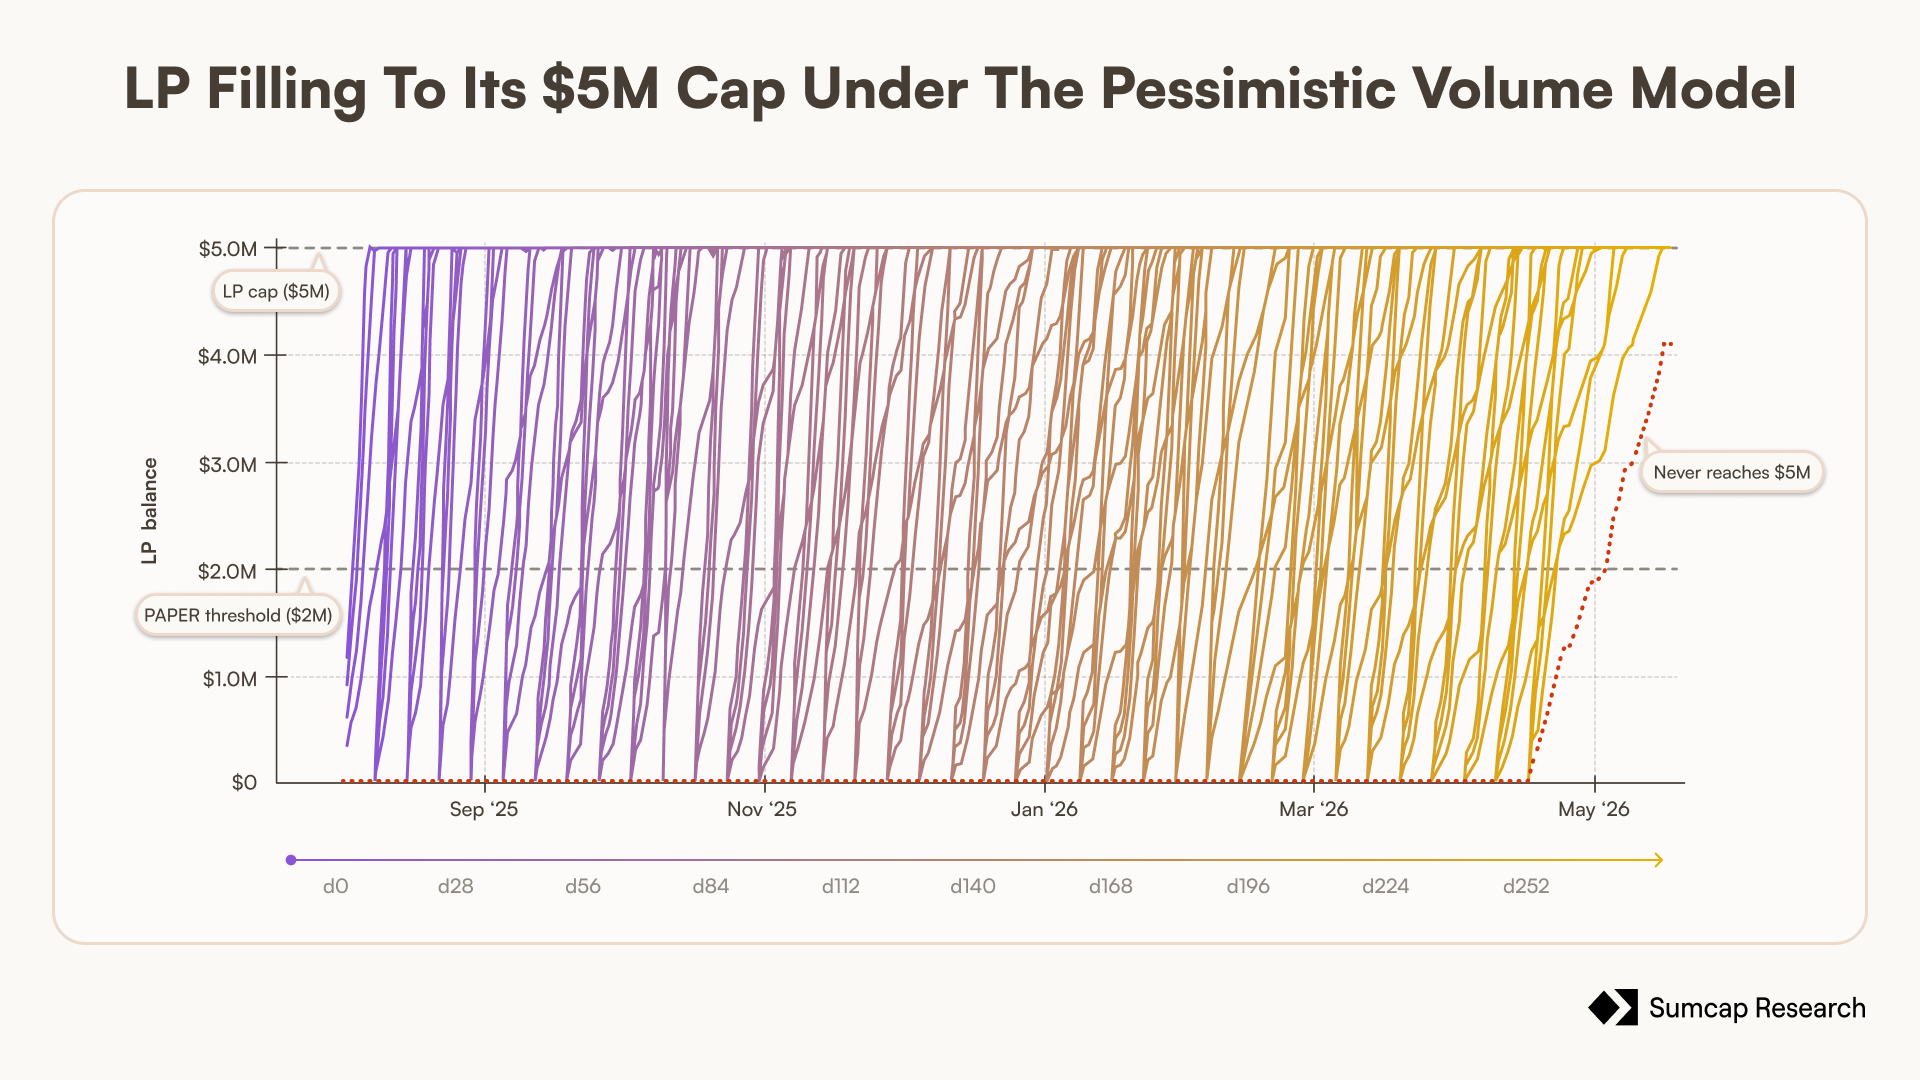
So the first question is settled: a pool seeded at zero and funded by losses does stay solvent at 1000x leverage under every configuration we tested. It reaches its $5M cap in about 5 days at full flow and roughly two weeks at a quarter of it; the slowest fill in the grid takes 36 days, and four low-flow runs launched on day 259 are still filling when the data ends - all four with zero residual debt.
8.2 The trader's side
The trader loses, and the loss is the whole point. Net of every win, traders give up between roughly $64M and $256M over the window in the base model, rising in step with flow, and between roughly $47M and $118M under the pessimistic model.
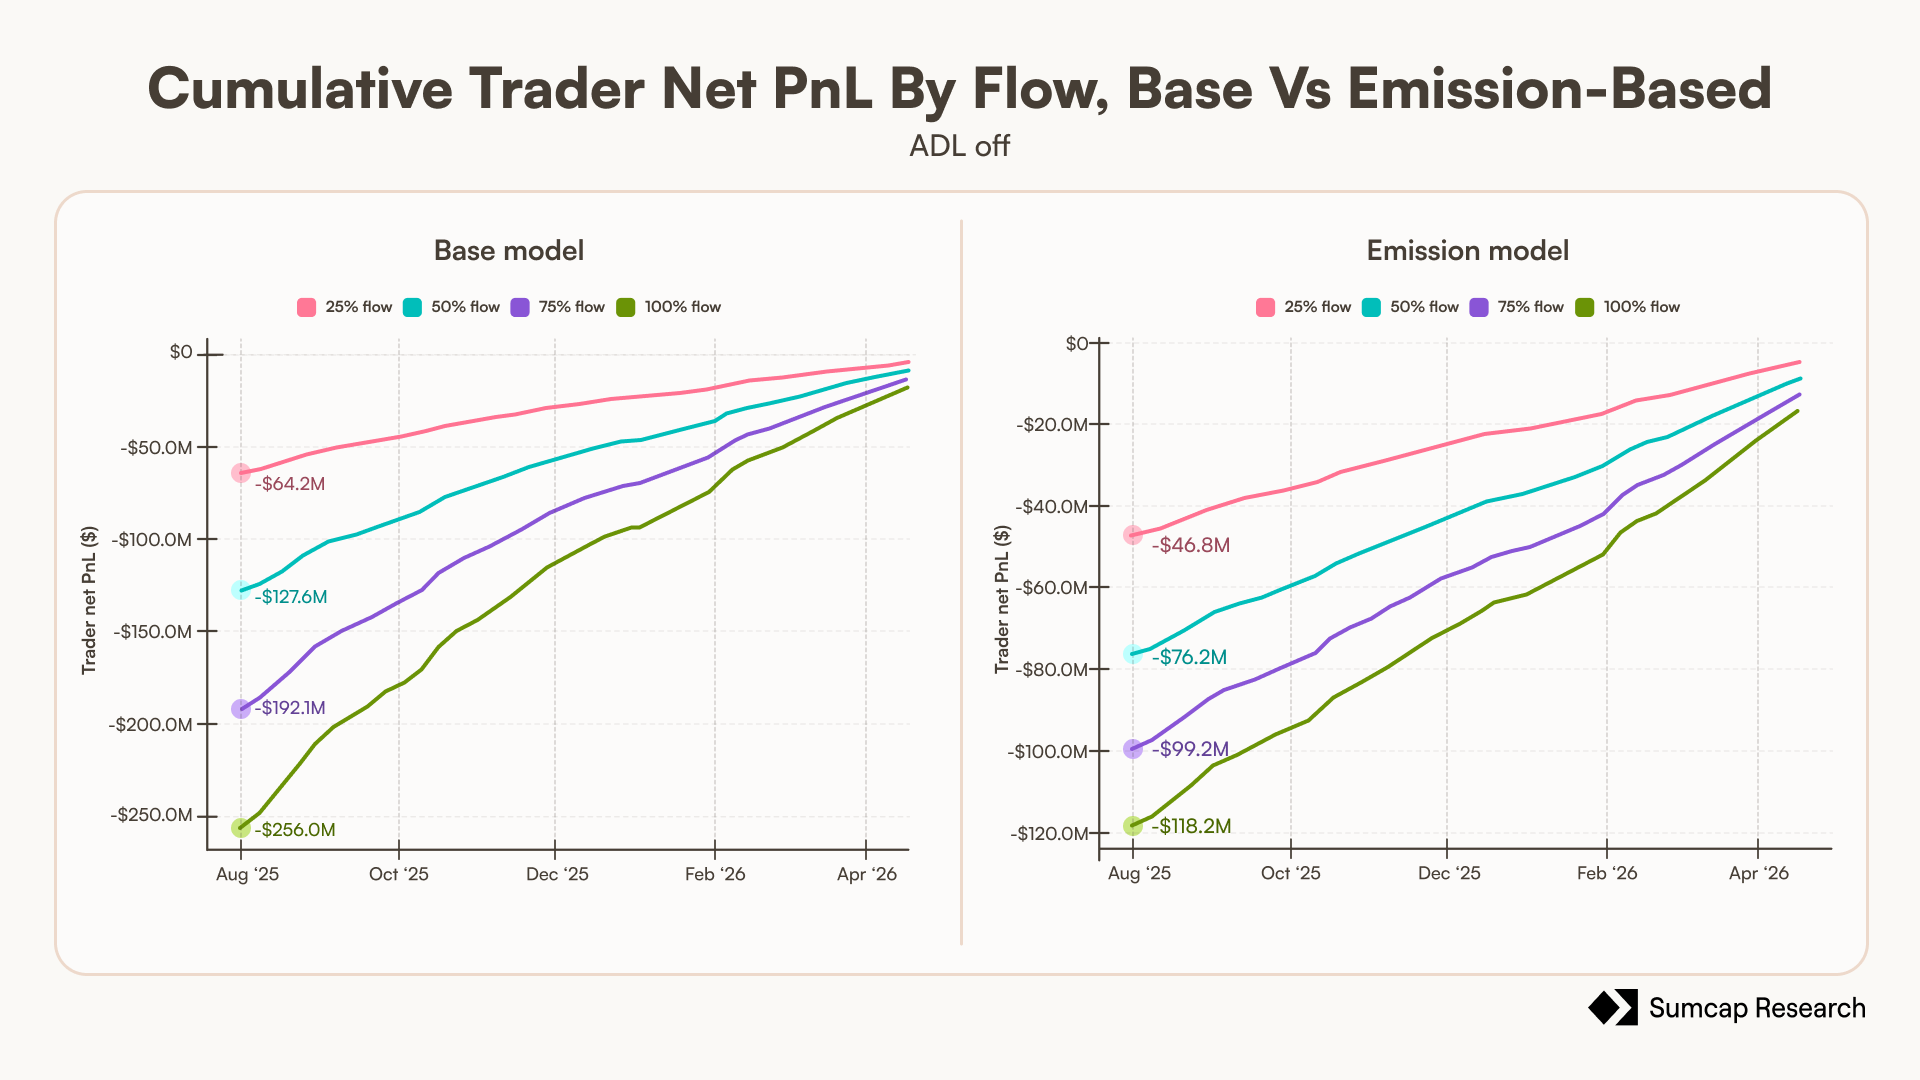
The size of the bleed is clearer in margin terms. Every position runs at 1000x, so the $350B of notional at full flow was opened against about $350M of posted margin, and traders lost $256M of it. That is 73 cents gone for every dollar of margin put up.
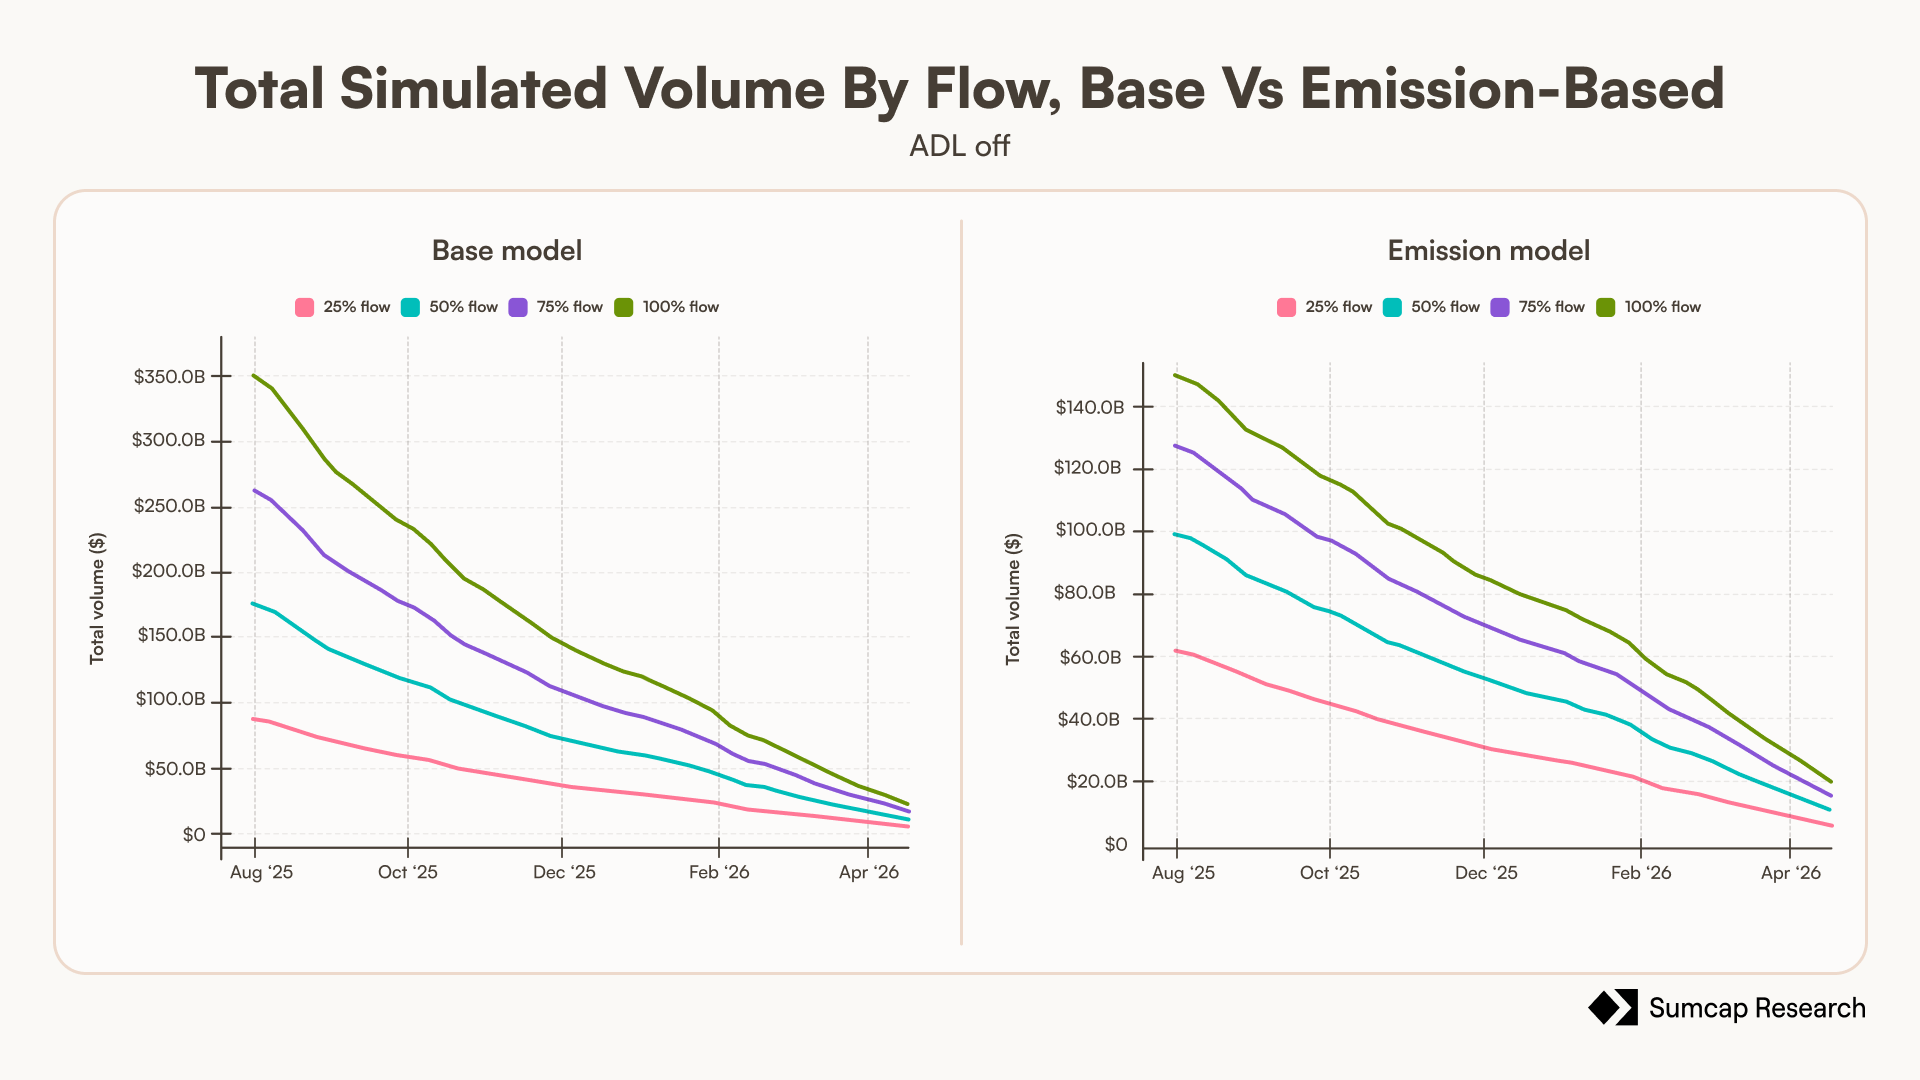
Across all eight flow and model cells, the trader's net loss equals the $5M LP plus cumulative protocol fees. At full flow the $256M traders lost is the $5M held in the pool plus the $251M paid out through the staker and frontend split, of which $248M went to stakers. Every dollar the trader gives up is a dollar the protocol keeps, and once the pool caps, a dollar the stakers keep. The curves tend towards 0 because the later the simulation starts, the fewer losses accumulate.
So in cash the house wins. The haircut on a winning close is about a tenth of the raw gain, so winners are paid very close to in full; what carries the pool is that at 1000x almost nobody wins at all. Four out of five BTC positions and nine out of ten on ETH are liquidated outright, and the losing margin arrives whole. The reason anyone plays is that the same dollar of loss mints $PAPER, and a cash-negative trader is not necessarily token-negative.
Whether that token claim is worth enough to make losing rational, and who ends up capturing it, is the question the follow-up takes up.
9. Conclusions
The first thing the simulation settles is that the mechanism works. A counterparty pool seeded at zero, funded by nothing but trader losses, running positions at 1000x, is the kind of design that sounds like it should fail on contact with a volatile market but it does not. In every one of the 608 scenarios the pool stays solvent, in all but one late, low-flow launch it fills its $5M cap inside the window, usually within days, and the rare moments when a winner cannot be paid resolve the same day.
The leverage explains why it is not close, and the impact curve barely enters into it. On Rollbit's x1000 parameters a winning trade keeps close to 90% of its raw gain at any move worth taking, so the pool pays its winners almost in full. What makes the arithmetic work is that at 1000x a position is liquidated by a 0.05% move against it, and only one BTC trade in nine in our data ever reaches a profitable close. The pool's income arrives whole and its liabilities almost never come due.
What makes the design interesting is that losing early is rewarded, because the same loss mints $PAPER at the one-cent floor, and that token is a claim on every loss that comes after. The protocol turns its earliest and most loss-prone users into its equity holders. The people who fund the pool in its first weeks are the ones who own the largest and cheapest share of its future revenue. It is a recruitment mechanism wearing the clothes of a token, and the data shows it working.
A trader who understands this has a reason to show up first and lose on purpose, which is a strange sentence to write about a derivatives venue and the clearest sign the design is doing something new. Whether that claim actually pays, how the yield compares to the token's inflation, and when the flywheel holds or breaks, is what the follow-up measures. On the narrower question this piece set out to answer, the verdict is clean. The pool cannot be drained, it fills its cap inside two weeks, and it stays solvent under every configuration we tested.
The pool cannot be drained. Whether the token makes it worth filling is the next question.

Papertrade: The House Always Wins
Can a pool funded by nothing but the losses of the people trading against it survive the people trading against it? We simulated it 608 times to find out.
1. Introduction
Papertrade is a synthetic perpetual protocol built on HyperEVM, offering up to 1000x leverage with no slippage. This is possible because trades on Papertrade are not matched against other users; instead, every position is a synthetic swap between the trader and the LP, which starts at $0 and is funded entirely by trading activity.
When a user opens a position, the contract reads Hyperliquid's Best Bid and Offer (BBO) mid price through a precompile and locks that price as the entry. When the position is closed, the contract reads the BBO mid again in the next block and settles the resulting PnL directly against the LP. As no perpetual contract is opened, traders pay no funding; and because execution happens at the BBO mid rather than through an order book, there is no slippage regardless of trade size.
2. How Papertrade Works
2.1 The synthetic trade
On most perpetual trading venues, your counterparty is another trader (an order book). On Papertrade, your counterparty is always the LP and your trades are always synthetic.
If you close at a loss your lost margin moves to the LP, but if you close at a profit, the protocol applies what it calls asymmetric impact to your realised gain. The asymmetric impact is a smooth scale factor applied on top of the raw gain. This scale factor is inversely proportional to the move a trader captures: the bigger the swing, the smaller the haircut - which incentivises users to chase large moves.
The formula for a winning close is:
\[\begin{aligned}\text{adjustedPnl} &= \text{rawPnl} \times \text{scale} \\[1em]\text{scale} &= \frac{1 - \text{baseRate}}{1 + \text{term1} + \text{term2}} \\[1em]\text{term1} &= \frac{1}{\text{move} \times \text{rateMultiplier}} \\[1em]\text{term2} &= \frac{\text{referenceNotional}}{\text{move} \times \text{positionMultiplier}} \\[1em]\text{move} &= \frac{\left|\text{exitPrice} - \text{entryPrice}\right|}{\text{entryPrice}}\end{aligned}\]
A deadband of 0.2bps is subtracted from move before anything else, the reduced move both feeds the scale factor and sets the gain that scale factor is applied to, so adjustedPnl is zero for any winning close below that threshold.
baseRate, rateMultiplier, positionMultiplier, and referenceNotional are per-instrument governance parameters. As move increases, both term1 and term2 decrease, and the denominator approaches 1, meaning the trader keeps a larger share of their rawPnl. As move approaches zero, term1 and term2 tend to infinity and the adjustedPnl collapses to zero.
There is a second, subtler reason for this PnL curve shape. Because the haircut is steepest on the smallest moves, an attacker who briefly distorts the order book to engineer a small profitable close finds much of the gain consumed by the steepness of the curve. Beneath the curve sits the 0.2bps deadband, half the CLOB spread.
2.2 The queue
Now the obvious problem. Since the LP starts at $0, what happens when the very first trade is a winner?
If a trader wins and the LP cannot cover the full payout (margin plus winnings), the margin is always returned, and the remaining winnings (after the asymmetric impact) are placed in a First In First Out (FIFO) queue. When the LP later receives money (from a loss or a liquidation), that money pays down the queue in order of arrival before it is allowed to grow the LP balance.
As long as traders keep coming back (and losing, filling up the LP), the protocol can keep paying winning trades.
The main concern is that a rational trader won't willingly trade against a pool that might not pay them, or an empty one. To counteract that, Papertrade pays its losing traders in $PAPER. Every dollar that moves into the LP from a loss or a liquidation mints the token. The rate is highest in the pool's earliest and most fragile days and decays as the LP grows, so the earliest losers mint far more per dollar than anyone who arrives later.
Once the LP fills its $5M cap, further trader losses route to $PAPER stakers rather than growing the pool. That is all the token detail this piece needs. What stakers actually earn on that stream, how the yield compares to the token's inflation, and whether holding $PAPER is economically rational, are the subject of a separate follow-up. Here the question is narrower, whether the pool itself survives.
3. Research Objective
While the protocol's economic architecture functions cohesively in theory, its long-term operational viability hinges on a critical, path-dependent assumption, that aggregate trader losses consistently outpace payouts to profitable counterparties.
Consequently, the central focus of this research is the structural sustainability of this mechanism. The underlying incentives exhibit intense reflexivity. The economic justification for minting $PAPER is entirely contingent upon LP solvency, yet the pool's solvency is inherently dependent on continuous trader liquidations.
We formally evaluate whether the LP can maintain structural solvency when funded exclusively by counterparty losses and bootstrapped entirely by token emissions, in a 1000x leverage environment. Whether the token that funds this is worth holding - how its yield compares to its inflation, and whether the incentive to lose survives as emission decays - is a separate question we take up in a follow-up.
Here the question is narrower: does the pool itself survive.
To stress-test the architecture, we replayed 3.6 million real Hyperliquid trades through Papertrade's rules, parameterised with Rollbit's published impact curve, across 608 scenarios, sweeping traction, launch timing, auto-deleveraging treatment, and volume decay.
4. Data Acquisition and Leverage Reconstruction
The empirical data of this analysis rests on three distinct data streams extracted from Hyperliquid: historical state snapshots, discrete trade execution fills from Hydromancer, and per-position leverage records from the HyperTracker API.
The snapshot dataset spans approximately 238 days but contains a 53-day gap extending from late October to mid-December 2025. Because of that, trade execution fills were ingested to capture every BTC and ETH transaction from August 1, 2025 onward, ensuring continuity. Additionally, HyperTracker per-position leverage data was obtained to provide ground-truth leverage readings independent of the snapshot schedule.
Integrating these three data types required reconciling distinct structural limitations:
- State Snapshots. Provided a direct reading of account leverage but were limited to daily frequency. Consequently, intraday positions opened and closed between snapshots were omitted.
- Execution Fills. Provided a high-fidelity, comprehensive ledger of all Hyperliquid activity, but lacked explicit metadata regarding leverage.
- HyperTracker Positions. Provided per-position leverage at the time of opening. BTC coverage is complete across the full simulation window (August 2025 to May 2026); ETH coverage extends from August to December 2025, with the remaining period relying on drawdown-bound classification and snapshots.
5. Assumptions
- We keep only the trades we could confirm ran at maximum leverage (40x on BTC, 25x on ETH), on the premise that Paper's 1000x venue draws the high-risk crowd that Hyperliquid's serious traders are not part of. This is the study's load-bearing assumption: it selects the population most likely to lose, and therefore most likely to keep the LP solvent, so we read the full-grid solvency result as conditional on it and return to how much it depends on the analogue in Limitations.
- Hyperliquid imposes no maximum notional per trade; Papertrade caps opening notional at $10M. We rescale the notional distribution linearly so its 99.9th percentile maps to the cap, then clamp the residual tail at $10M - preserving the shape of the size distribution below the cap while respecting the protocol's ceiling.
- We model four levels of traction (25%, 50%, 75%, 100% of flow) by random subsampling, so lower flow is a random thinning of the same population with composition held fixed. A smaller or newer venue might draw a different mix, but absent data on what that mix would be, neutral subsampling is the conservative choice and preserves the size distribution at every level.
- Every protocol parameter in the simulation - leverage, caps, the emission schedule, and all four impact-curve knobs - is taken from a published configuration and held fixed. The impact-curve knobs are Rollbit's, since Papertrade's own calibration is not public, referenceNotional differs between the two protocols as in Rollbit's formula referenceNotional is the real notional of the position, whereas Papertrade holds it fixed. We use $100,000 throughout.
- We model BTC and ETH only, and treat the Hyperliquid prices in our data as the prices Paper would settle against - assuming the spread between a fill and the BBO mid, and the one-block lag between Paper's entry and exit reads, are negligible against the large moves that dominate this dataset.
- We model no trading fee or gas cost beyond the asymmetric-impact haircut, and treat a position as liquidated the moment its worst adverse move reaches the 5bps tolerance. Both choices are conservative for the LP: ignoring fees understates protocol income, and the liquidation mapping is, if anything, generous to the trader.
6. Limitations
Once-daily snapshots miss intraday positions. We argue these are negligible for this purpose, but it is an assumption, not a measurement.
Leverage reconstructed from fills is imprecise, particularly for cross-margin positions in the 53-day gap.
Behavioural analogue, not the real population. Max-leverage Hyperliquid traders are a proxy for Papertrade degens. Papertrade's own incentives (minting $PAPER on losses) would likely shift behaviour further toward risk than the source data shows.
No reflexive $PAPER price feedback. The simulation models the LP and emission mechanics, not the market price of $PAPER.
OI safety caps assumed non-binding. The $10M notional cap is enforced; the separate OI safety caps are assumed not to have bound in the simulated window.
Parameters are governance-adjustable. All results hold for the deployed configuration. The impact-curve knobs are per-instrument governance parameters and could be retuned after launch.
7. Methodology
7.1 What we simulated
We implemented Papertrade's complete settlement mechanism and pushed all 3.6M trades through it in chronological order, day by day, from day 0 to day 289. The mechanics are exactly as described above under How Papertrade works. This section covers the protocol parameters, what the deployed impact curve actually does to a winning trade, and the modelling assumptions we layered on top.
7.2 The parameters
Every number in the settlement mechanics is held fixed across the whole grid. All of them are Papertrade's own published configuration, except the four impact-curve knobs: Papertrade has not published its calibration, so baseRate, rateMultiplier and positionMultiplier are Rollbit's published x1000 values. The fourth, referenceNotional, has no Rollbit constant to borrow as Rollbit uses the position's real notional where Papertrade holds it fixed, to solve this, we use a $100K stand-in described in How Papertrade works.
A liquidation threshold of 5bps means a position is treated as liquidated once its worst adverse move reaches 0.05%.
tailScaleUsd is the parameter that controls the shape of the emission decay, the larger it is, the more slowly minting ratchets down once the LP clears $2M.
The protocol fee is the slice of each dollar of protocol income peeled off while the LP is under $5M, split evenly between $PAPER stakers and the frontend; once the cap is full the split flips to 99% stakers, 1% frontend.
7.3 What the curve actually does
Two things follow directly from that table.
First, the haircut on any realistic win is small. The curve reaches its ceiling almost immediately: a BTC trader keeps a quarter of the raw gain from a move of 0.0095%, half from 0.0235%, and by 1% is already keeping 88.6% - close to the 90% the formula allows at the limit. Every move large enough to be worth taking sits on the flat part of the curve, so in practice a winning close on this venue surrenders about a tenth of its raw PnL in exchange for the extreme leverage. The curve bites only inside the first few thousandths of a percent, which is well below the 0.05% line at which the same position would already have been liquidated.
Second, the difference between the two assets is real but immaterial. Only the ratio referenceNotional / positionMultiplier enters term2, and ETH's ratio is exactly 1.5 times BTC's - but both ratios are small enough that term2 barely moves the denominator. At a 1% move a BTC winner keeps 88.6% and an ETH winner 88.3%. Whatever disadvantage the ETH max-leverage trader carries in our data comes from the size of their adverse moves, not from the curve.
The reason ETH is wiped more often than BTC is the size of the moves. The worst adverse move on a typical BTC max-leverage trade is around 0.22%, and on ETH around 0.41%, both far past the 0.05% liquidation line - BTC liquidates 80.1% of the time and pays off 11.2%; the remaining 8.7% closed under water without ever touching the 5bps line (8.0%) or settled at brake even. ETH liquidates 91.5% and pays off 6.7%, with 1.9% in that same residual, the smaller share precisely because ETH liquidates more.
Counting liquidations and partial losses together, 88.1% of BTC trades and 93.1% of ETH trades hand money to the LP.
7.4 Modelling choices
Flow fractions. Among our 3.6M trades we simulate four flow levels - 25%, 50%, 75%, 100% - by random sampling; see assumption 3.
Start days. As some windows are far more volatile than others, sweeping the start date isolates how much the verdict depends on the luck of when the protocol goes live, that's why we simulated 38 launch dates, one every 7 days.
ADL worst-case. As Papertrade doesn't have ADL but our data does, we run the grid with auto-deleveraging off and on. Off, trades are replayed as-is. On, we use real Hyperliquid ADL data and see what happens if all the trades that got auto-deleveraged closed at the tip of that day's wick (the most the trader's PnL could have reached on a given day). This is a deliberate worst case.
Emission-based volume. This is the one assumption that feeds the mechanism back into trader behaviour, and it deserves spelling out. The main reason to trade into this LP at all is the $PAPER you mint by losing; as the LP matures past $2M and emission decays, that incentive weakens, so we could expect the flow to contract over time.
The full simulation code is available here.
8. Results
8.1 The survival rate
Across the full grid of 608 scenarios, spanning every launch date, every flow level, both ADL modes, and both volume models, the pool ends solvent in 100% of runs - for the max-leverage cohort this study models, which is by construction the population most prone to the losses that feed the pool. Better than that, in 494 of the 608 (81.2%) the pool never has to queue a single winner, as the LP absorbs the early losses fast enough that there is usually cash on hand to pay whoever wins.
When the pool does fall short, the shortfall is small and instant. Across all 608 runs the largest single unpaid amount ever recorded is $61,974 and the queue never holds more than seventy trades at once; both records belong to the same run, a 25%-flow pool launched on day 91. No debt survives the day it is created, and every queued trade in that worst case was paid in full. The 114 debt events across the grid concentrate at the thinnest flow - forty-six at 25%, twenty-four at 50%, sixteen at 75% - but they do not disappear at full flow, where twenty-eight remain.
The reason debt is so rare is that the pool fills quickly. Starting from $0, launching on day 0 at full flow, the LP hits $5M in about 5 days; at a quarter of Hyperliquid's real max-leverage volume it takes roughly 14 days. Flow is the only thing that materially changes the speed, more traders means a faster fill.
Launch timing matters only at the edges, as we see below. Pools that go live into the most volatile stretch of the sample, late 2025, take a little longer to fill and account for almost all of the rare debt events, but they still reach the cap and still end solvent. The only scenarios that never reach $5M are a single launch date, day 259 at 25% flow, which appears once in each of the four grid cells and whose 290-day window simply ends before the pool gets there. At that flow the fill takes weeks rather than days - the slowest pool that does reach the cap needs 36 - and even those four finish with zero residual debt.
Turning on real Hyperliquid auto-deleveraging, our deliberately worst-case stress, leaves LP recovery visually unchanged as the pool is fed fast enough to absorb even the inflated winners. On the other hand, the pessimistic flow model, where trader volume contracts in lockstep with the fading $PAPER incentive, shrinks the entire economy around the pool (less volume, less $PAPER, smaller trader losses) without threatening survival. The LP still fills to $5M from every launch date but the last, which runs out of data.
So the first question is settled: a pool seeded at zero and funded by losses does stay solvent at 1000x leverage under every configuration we tested. It reaches its $5M cap in about 5 days at full flow and roughly two weeks at a quarter of it; the slowest fill in the grid takes 36 days, and four low-flow runs launched on day 259 are still filling when the data ends - all four with zero residual debt.
8.2 The trader's side
The trader loses, and the loss is the whole point. Net of every win, traders give up between roughly $64M and $256M over the window in the base model, rising in step with flow, and between roughly $47M and $118M under the pessimistic model.
The size of the bleed is clearer in margin terms. Every position runs at 1000x, so the $350B of notional at full flow was opened against about $350M of posted margin, and traders lost $256M of it. That is 73 cents gone for every dollar of margin put up.
Across all eight flow and model cells, the trader's net loss equals the $5M LP plus cumulative protocol fees. At full flow the $256M traders lost is the $5M held in the pool plus the $251M paid out through the staker and frontend split, of which $248M went to stakers. Every dollar the trader gives up is a dollar the protocol keeps, and once the pool caps, a dollar the stakers keep. The curves tend towards 0 because the later the simulation starts, the fewer losses accumulate.
So in cash the house wins. The haircut on a winning close is about a tenth of the raw gain, so winners are paid very close to in full; what carries the pool is that at 1000x almost nobody wins at all. Four out of five BTC positions and nine out of ten on ETH are liquidated outright, and the losing margin arrives whole. The reason anyone plays is that the same dollar of loss mints $PAPER, and a cash-negative trader is not necessarily token-negative.
Whether that token claim is worth enough to make losing rational, and who ends up capturing it, is the question the follow-up takes up.
9. Conclusions
The first thing the simulation settles is that the mechanism works. A counterparty pool seeded at zero, funded by nothing but trader losses, running positions at 1000x, is the kind of design that sounds like it should fail on contact with a volatile market but it does not. In every one of the 608 scenarios the pool stays solvent, in all but one late, low-flow launch it fills its $5M cap inside the window, usually within days, and the rare moments when a winner cannot be paid resolve the same day.
The leverage explains why it is not close, and the impact curve barely enters into it. On Rollbit's x1000 parameters a winning trade keeps close to 90% of its raw gain at any move worth taking, so the pool pays its winners almost in full. What makes the arithmetic work is that at 1000x a position is liquidated by a 0.05% move against it, and only one BTC trade in nine in our data ever reaches a profitable close. The pool's income arrives whole and its liabilities almost never come due.
What makes the design interesting is that losing early is rewarded, because the same loss mints $PAPER at the one-cent floor, and that token is a claim on every loss that comes after. The protocol turns its earliest and most loss-prone users into its equity holders. The people who fund the pool in its first weeks are the ones who own the largest and cheapest share of its future revenue. It is a recruitment mechanism wearing the clothes of a token, and the data shows it working.
A trader who understands this has a reason to show up first and lose on purpose, which is a strange sentence to write about a derivatives venue and the clearest sign the design is doing something new. Whether that claim actually pays, how the yield compares to the token's inflation, and when the flywheel holds or breaks, is what the follow-up measures. On the narrower question this piece set out to answer, the verdict is clean. The pool cannot be drained, it fills its cap inside two weeks, and it stays solvent under every configuration we tested.
The pool cannot be drained. Whether the token makes it worth filling is the next question.
.svg)