The Token Economics of Papertrade

Papertrade, Tokenomics, Perps, DeFi

We proved the mechanism holds, but the harder question is whether $PAPER gives anyone a reason to keep it turning.

Share this article:
LinkedinX
September 15, 2026

Introduction

The first piece settled that Papertrade is mechanically resilient, and that a pool seeded at zero and funded only by trader losses stays solvent at 1000x under all 608 scenarios we ran on a Rollbit-based impact curve. But that study did not answer whether their token is economically viable and attractive.

Papertrade can be mechanically sound and still fail economically if nobody has a durable reason to keep trading, holding, and staking the token that bootstraps it. Papertrade pays its losing traders in $PAPER, and the whole flywheel rests on its value. So this piece asks a different thing: does $PAPER create incentives strong enough to keep the flywheel turning?

Briefly, the mechanic we are pricing. Every dollar of trader loss mints $PAPER, whether or not the LP is at its cap, at a flat 100 per dollar while cumulative LP gains are under $2M and along a decaying tail after that. While the LP is still filling toward its $5M cap, a 2% protocol fee is peeled off each dollar of income (1% to $PAPER stakers, 1% to the frontend) and the other 98% grows the pool. So minting tracks total trader losses, and the cap only decides whether each dollar grows the pool or pays the stakers, never whether it mints.

This piece builds directly on the first and does not repeat its groundwork. How Papertrade works, how simulations are run, the assumptions behind them, and their limitations are all set out in the first article. The full simulation code is available at https://github.com/HakaiRhinohl/PaperTrade-Simulations.

1. Emission schedule and inflation pressure

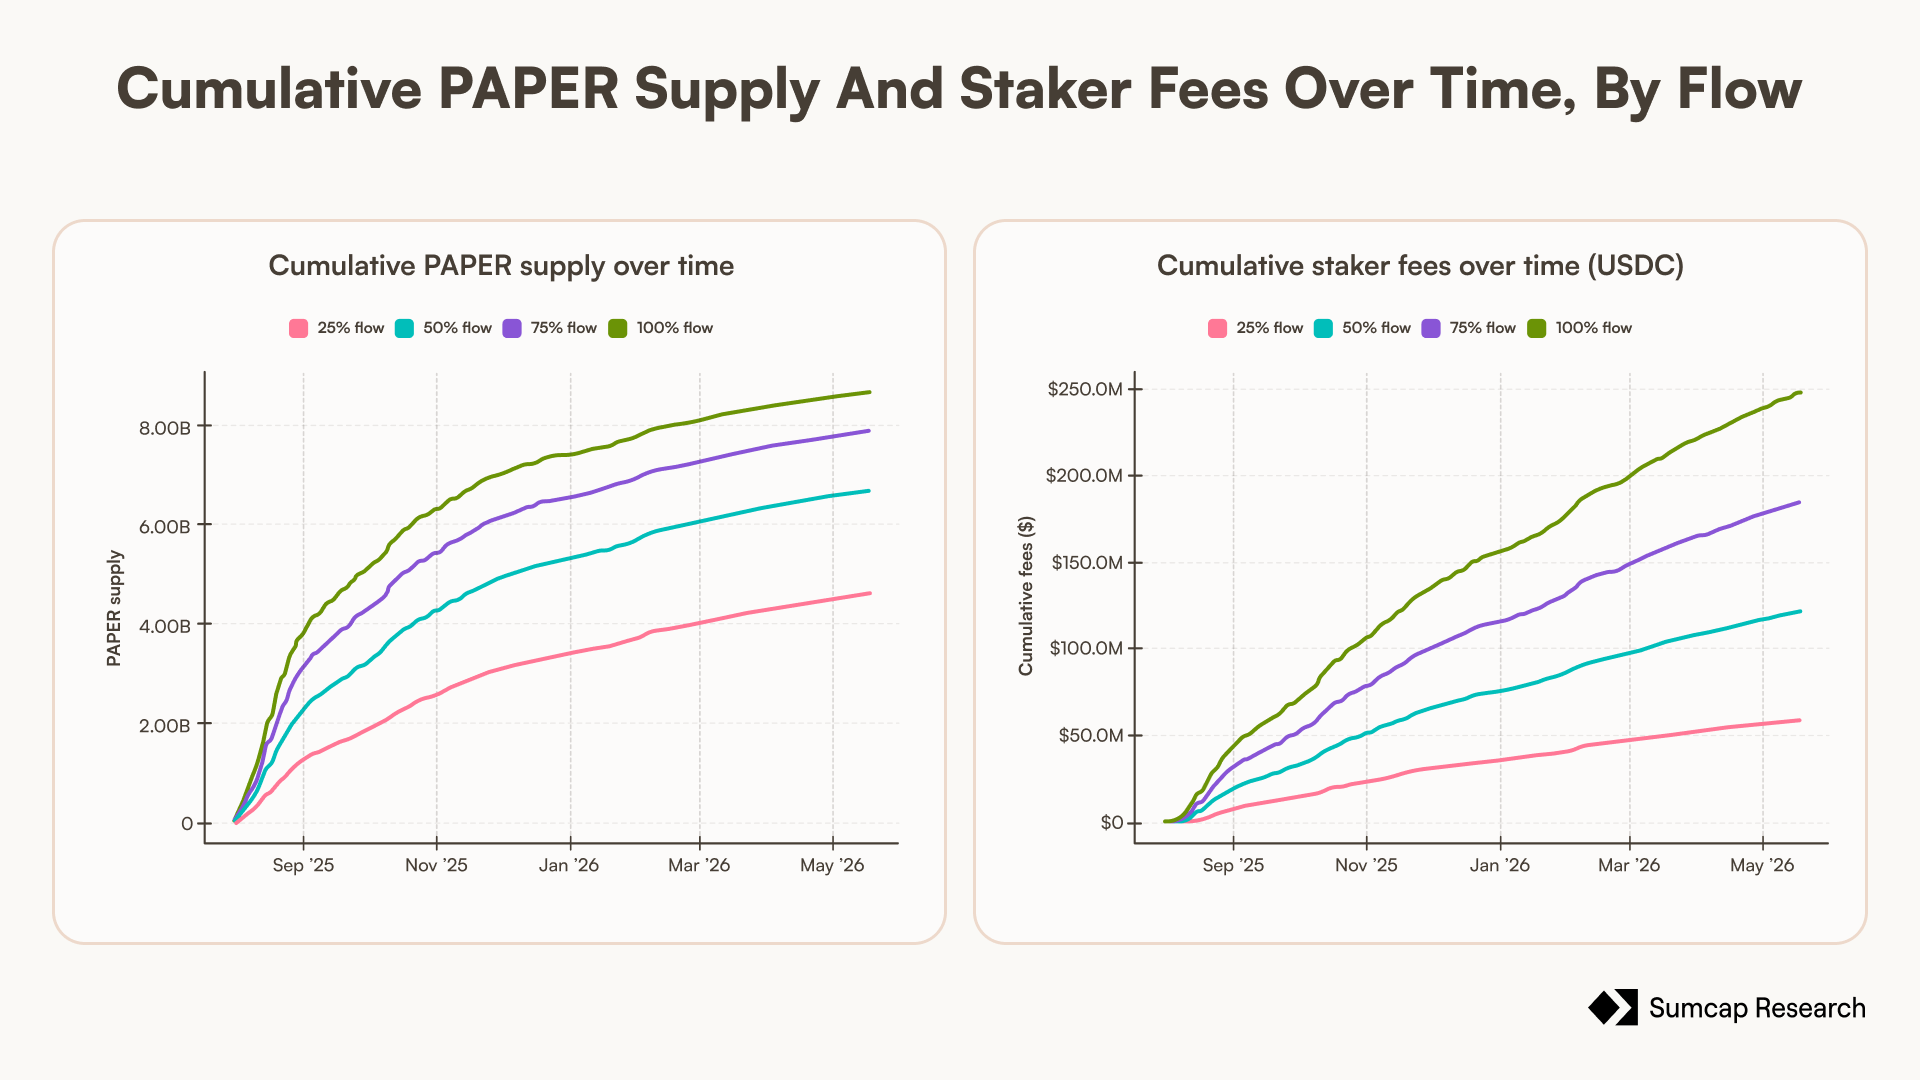
Every $PAPER that will ever exist is minted by a loss, and the schedule is steep at the start and flat at the end. Total supply runs from about 4.6 billion at a quarter of Hyperliquid's volume to about 8.6 billion, and roughly 3.7 to 6.4 billion under the pessimistic volume model.

Figure 1 - Cumulative $PAPER supply and staker fees over time, by flow

The issuance is heavily front-loaded. At full flow, launching on day 0, 43.6% of all the $PAPER that will ever be minted is minted before the marginal cost doubles off the floor, which happens on day 30, and 72.6% is minted inside the first 90 days. The mechanism is the squared decay term in the emission rate, which drops fast once the LP clears $2M and never recovers because it tracks a high-water mark; the cost doubles once that tail high-water mark reaches $49.7M of cumulative gain.
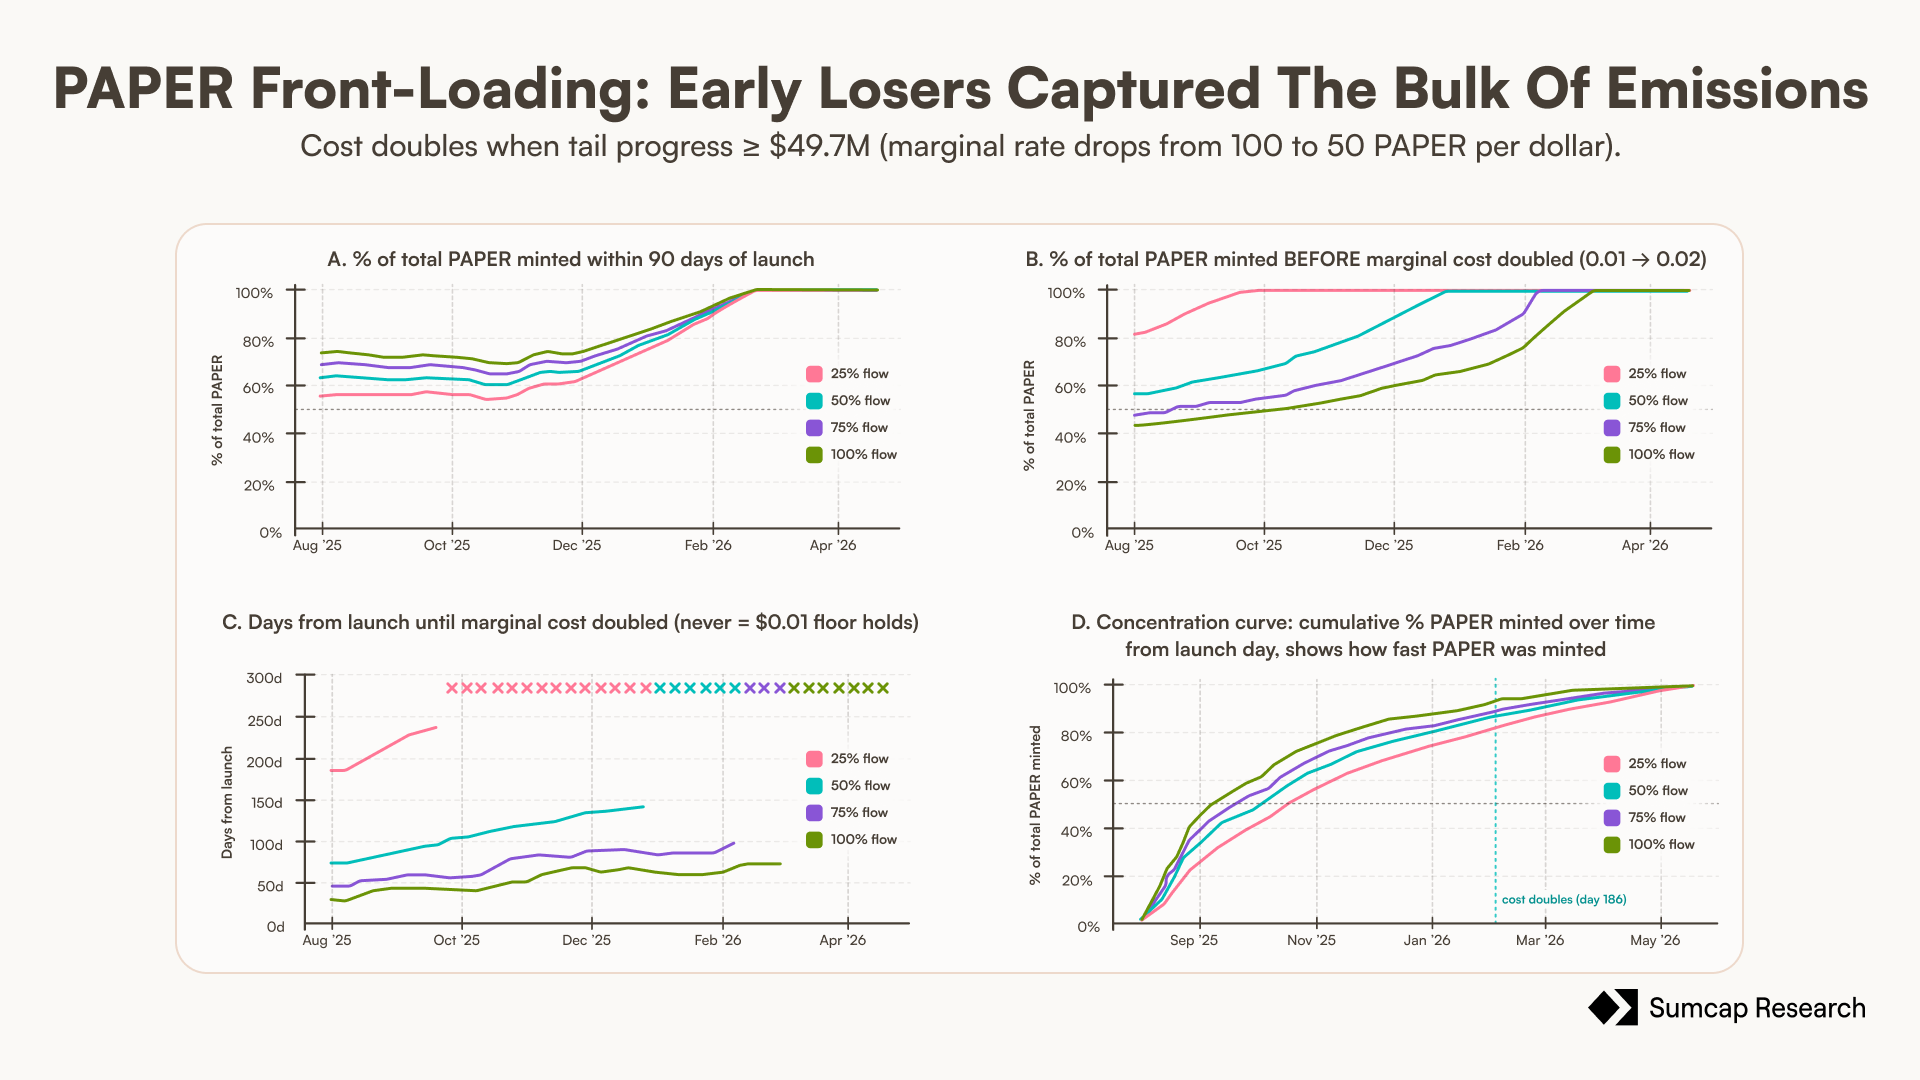
Figure 2 - How front-loaded emission is, the share of $PAPER minted early and how fast

The marginal cost starts at the one-cent floor and climbs with flow: by the end of the window it sits near 2.5 cents at a quarter of flow, 4.7 at half, 7.6 at three quarters and about 11 cents at full flow. Averaged over the whole run it goes from 1.5 cents at a quarter of flow to 3.3 at full flow.
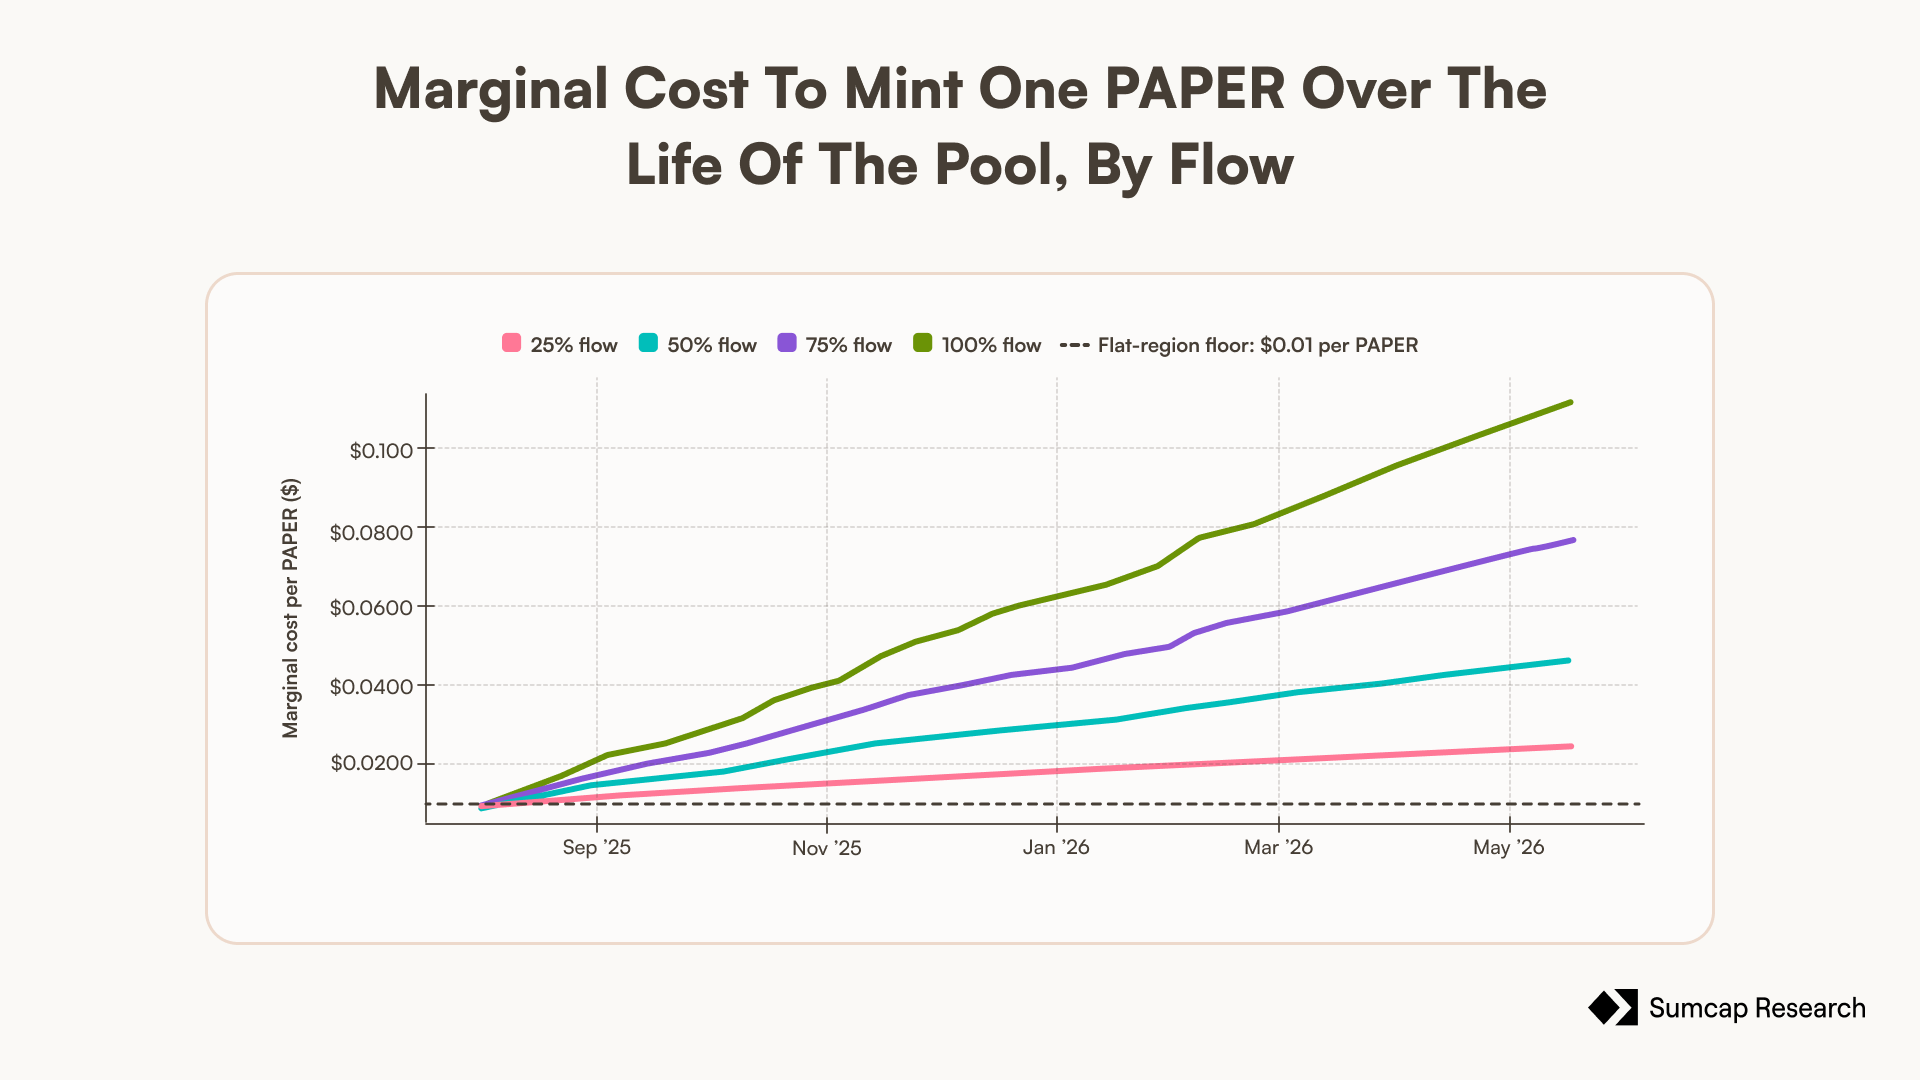
Figure 3 - Marginal cost to mint one $PAPER over the life of the pool, by flow

Inflation is highest when the pool is most fragile to incentivise traders, while the LP is under $2M and the rate is pinned at 100 $PAPER per dollar ($0.01 per $PAPER), and it decays toward zero as the supply curve flattens. A token earned late faces much less dilution than a token earned at the floor when the inflation was the highest. Expressing emission as a periodic inflation rate (new $PAPER over circulating $PAPER) makes that trade explicit and sets up the real-yield question in section 3.

The rate spikes past 10,000% annualised in the opening days, then collapses as the supply base grows. It settles to a final annualised rate that is lower the higher the flow, from 54.0% at a quarter of flow down to 23.4% at full flow.
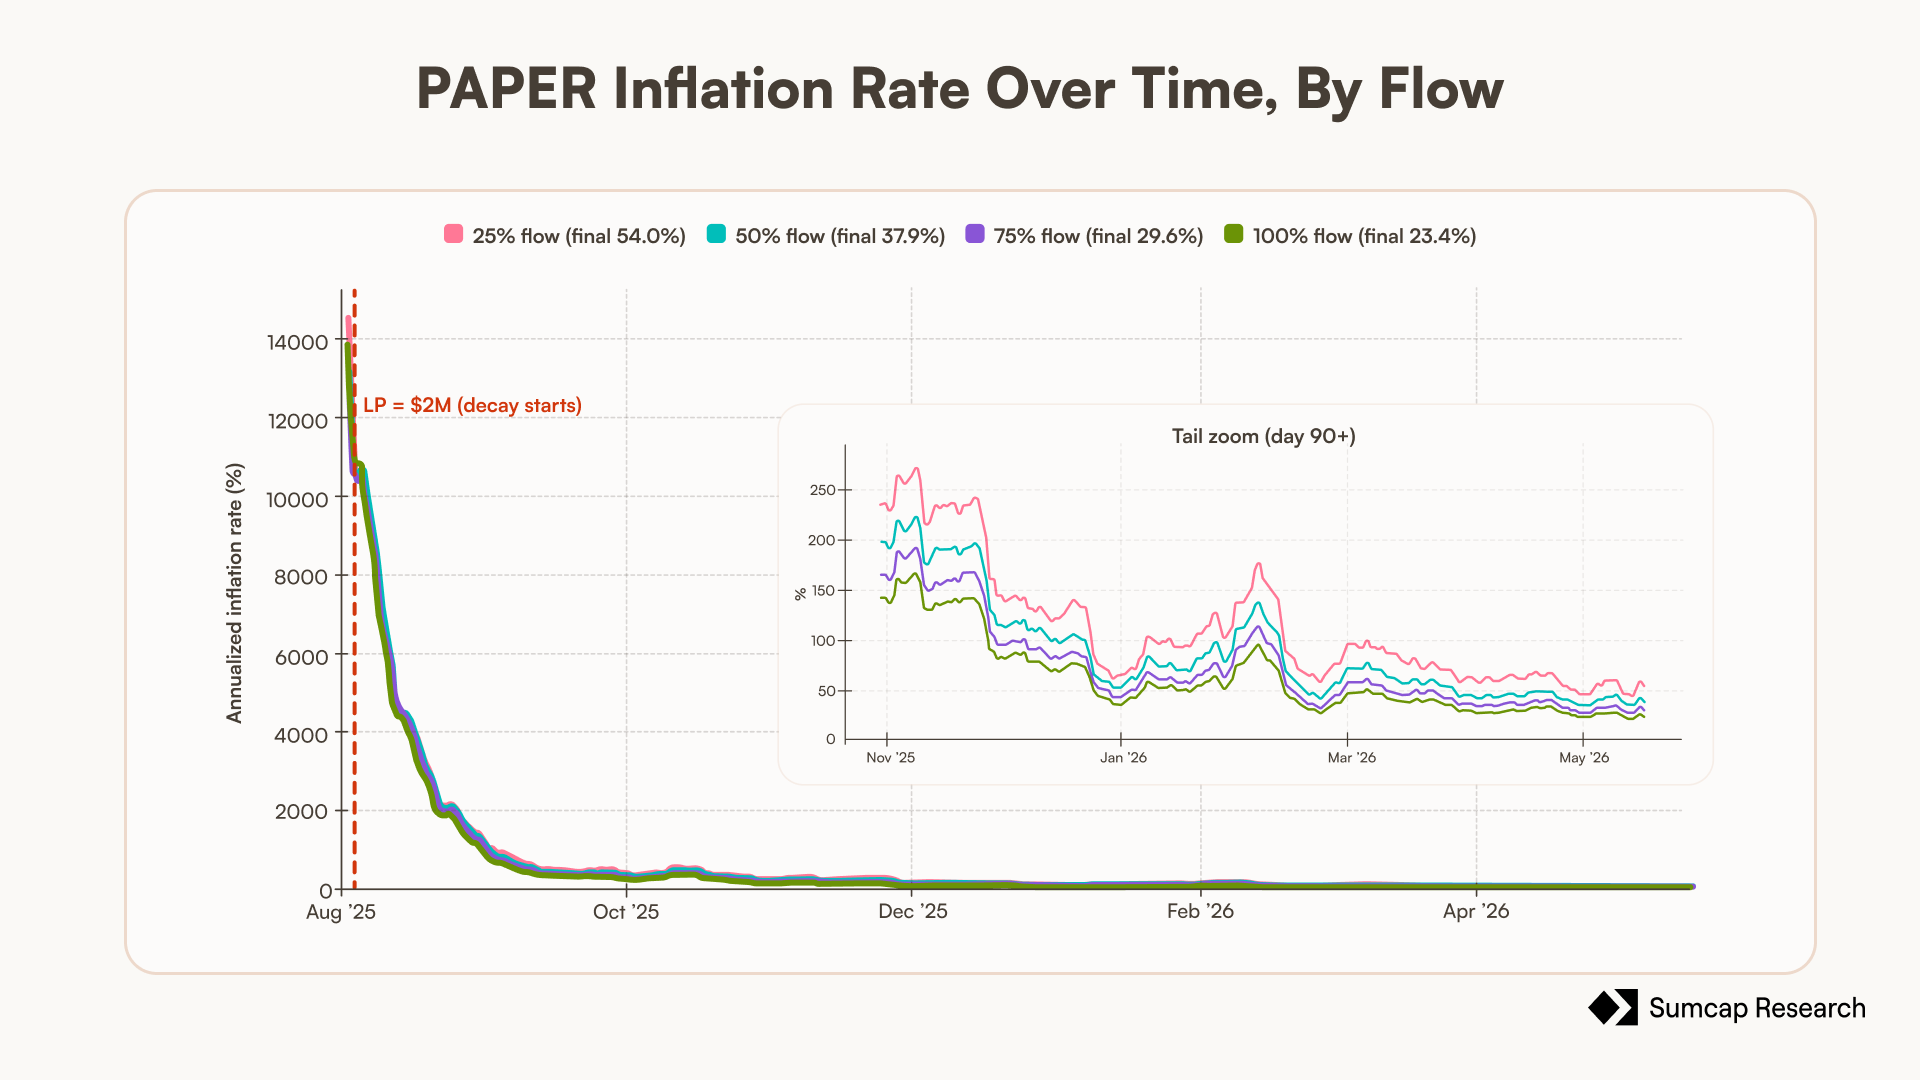
Figure 4 - $PAPER inflation rate over time, new tokens as a share of circulating supply, by flow

Annualised inflation is highly sensitive to the initial supply base. The early spike reflects issuance occurring while circulating supply was still very small, so it should not be interpreted as a sustainable forward rate. As supply scales, the annualised rate normalises quickly, falling from extreme early readings to a few hundred percent within the first few months and to roughly 24 to 54% by the end of the period depending on the flow assumption.

2. Fee generation and the dividend per $PAPER

Cumulative staker fees over the window run from about $59M at a quarter of Hyperliquid's volume to about $248M at full flow in the base model, and roughly $41M to $112M under the pessimistic model.
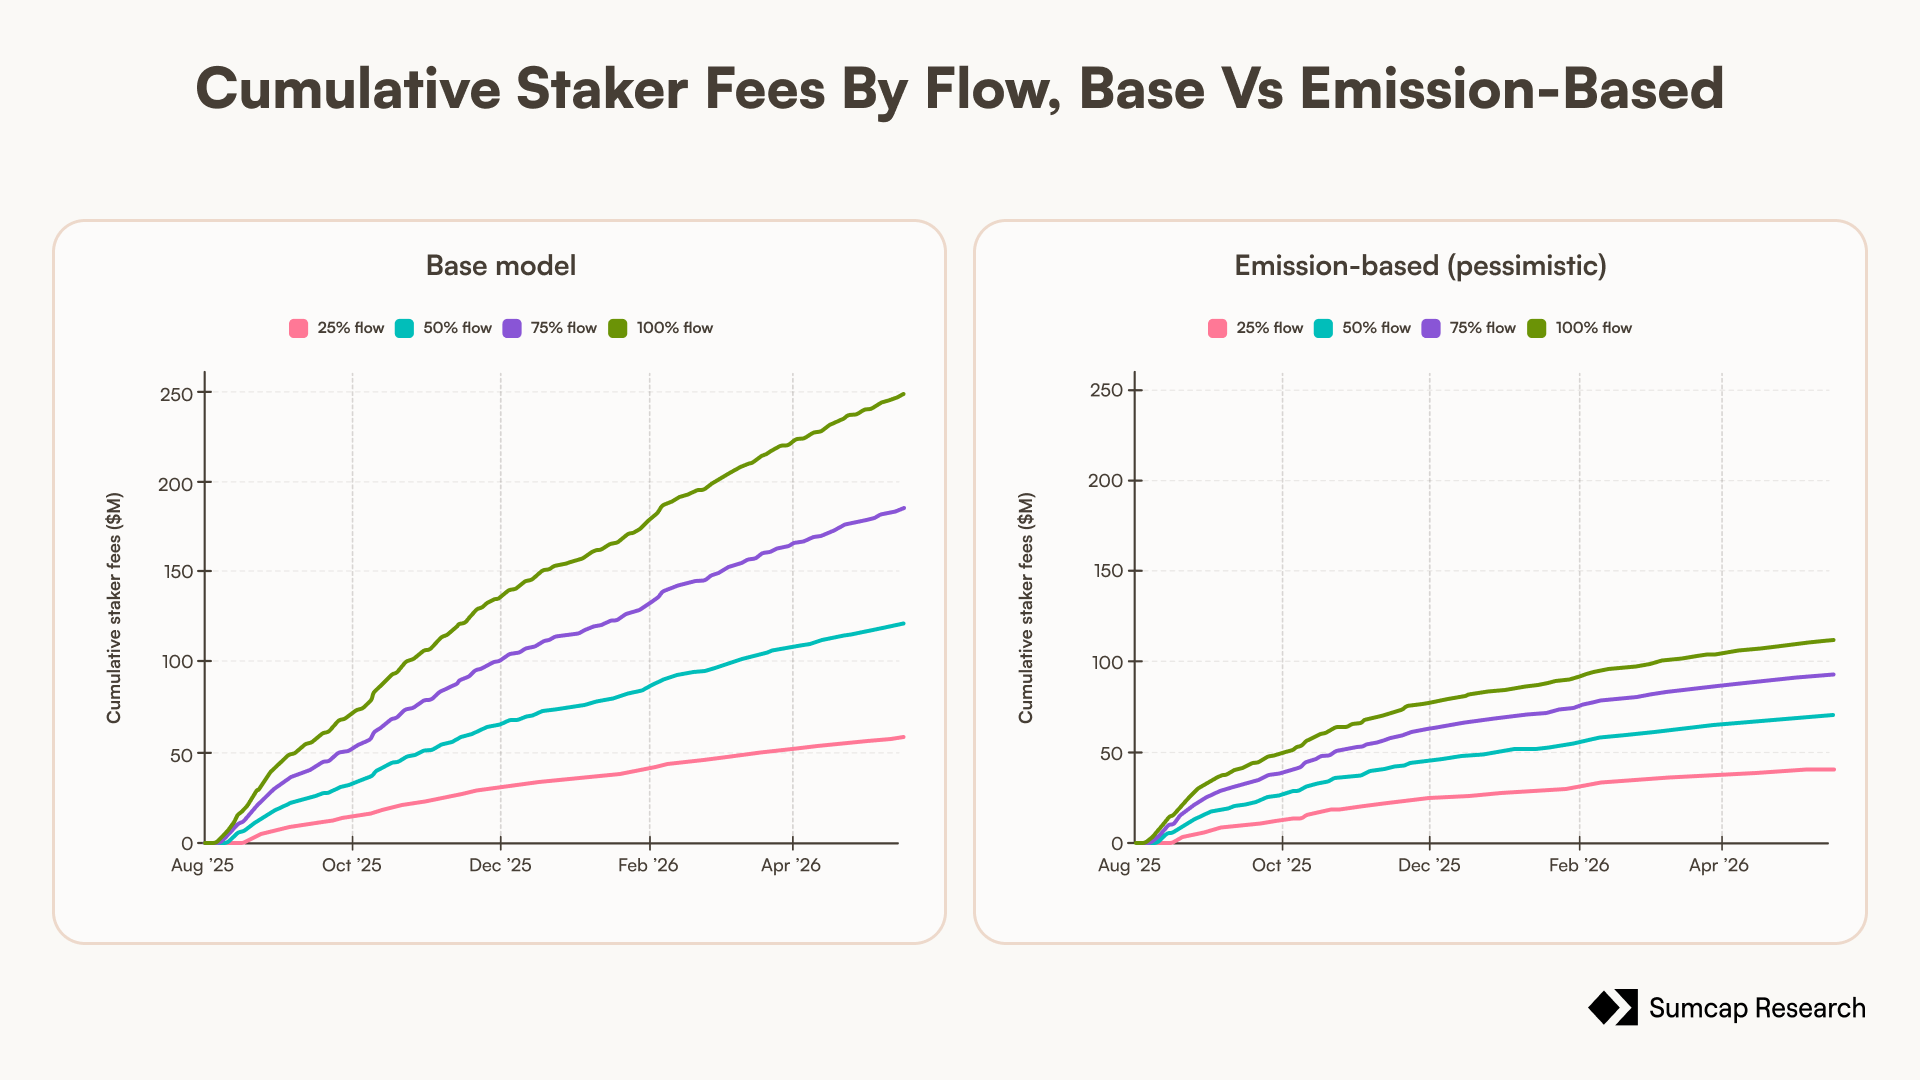
Figure 5 - Cumulative staker fees by flow, base versus emission-based volume

The dividend per token is the fee stream divided by the staked supply, and its shape is the key result of this piece. Supply is front-loaded and flattens but fees arrive at a roughly constant rate across the whole window. So the cumulative dividend per token climbs while the supply curve plateaus, which means the payout per token improves over time. An early loser captures a front-loaded share of the tokens and then collects on them slowly, as everyone who trades after them keeps losing.

2.1 The two fee regimes, and a zoom before the cap

There are two fee regimes and they are very different. While the LP is filling toward $5M, stakers receive only a 1% slice of protocol income (the frontend takes a matching 1%), with the other 98% going to fill the pool. Once the cap is full, the split flips and 99% of every further dollar of trader losses goes to stakers. Since the pool fills in 5 to 14 days depending on flow, the pre-cap regime is only a couple of weeks long at most, so the pre-cap dividend per token is close to negligible.

What makes that worth a closer look is what emission is doing at the very same time. The pre-cap window is exactly when the emission rate is at its maximum. The two curves move in opposite directions across that opening window. Whoever mints there buys the largest and cheapest claim on the protocol precisely when that claim is paying almost nothing, and is repaid only later, once the cap is full and the entire loss stream routes to stakers. Splitting the fees at the cap shows how lopsided the two regimes are, and zooming the early window puts the peak of emission and the trough of fees on the same axis so the mismatch is visible directly.

The pre-cap window accounts for between 0.4% and 2.9% of the lifetime protocol fee stream depending on flow. Essentially the entire dividend is a post-cap phenomenon.
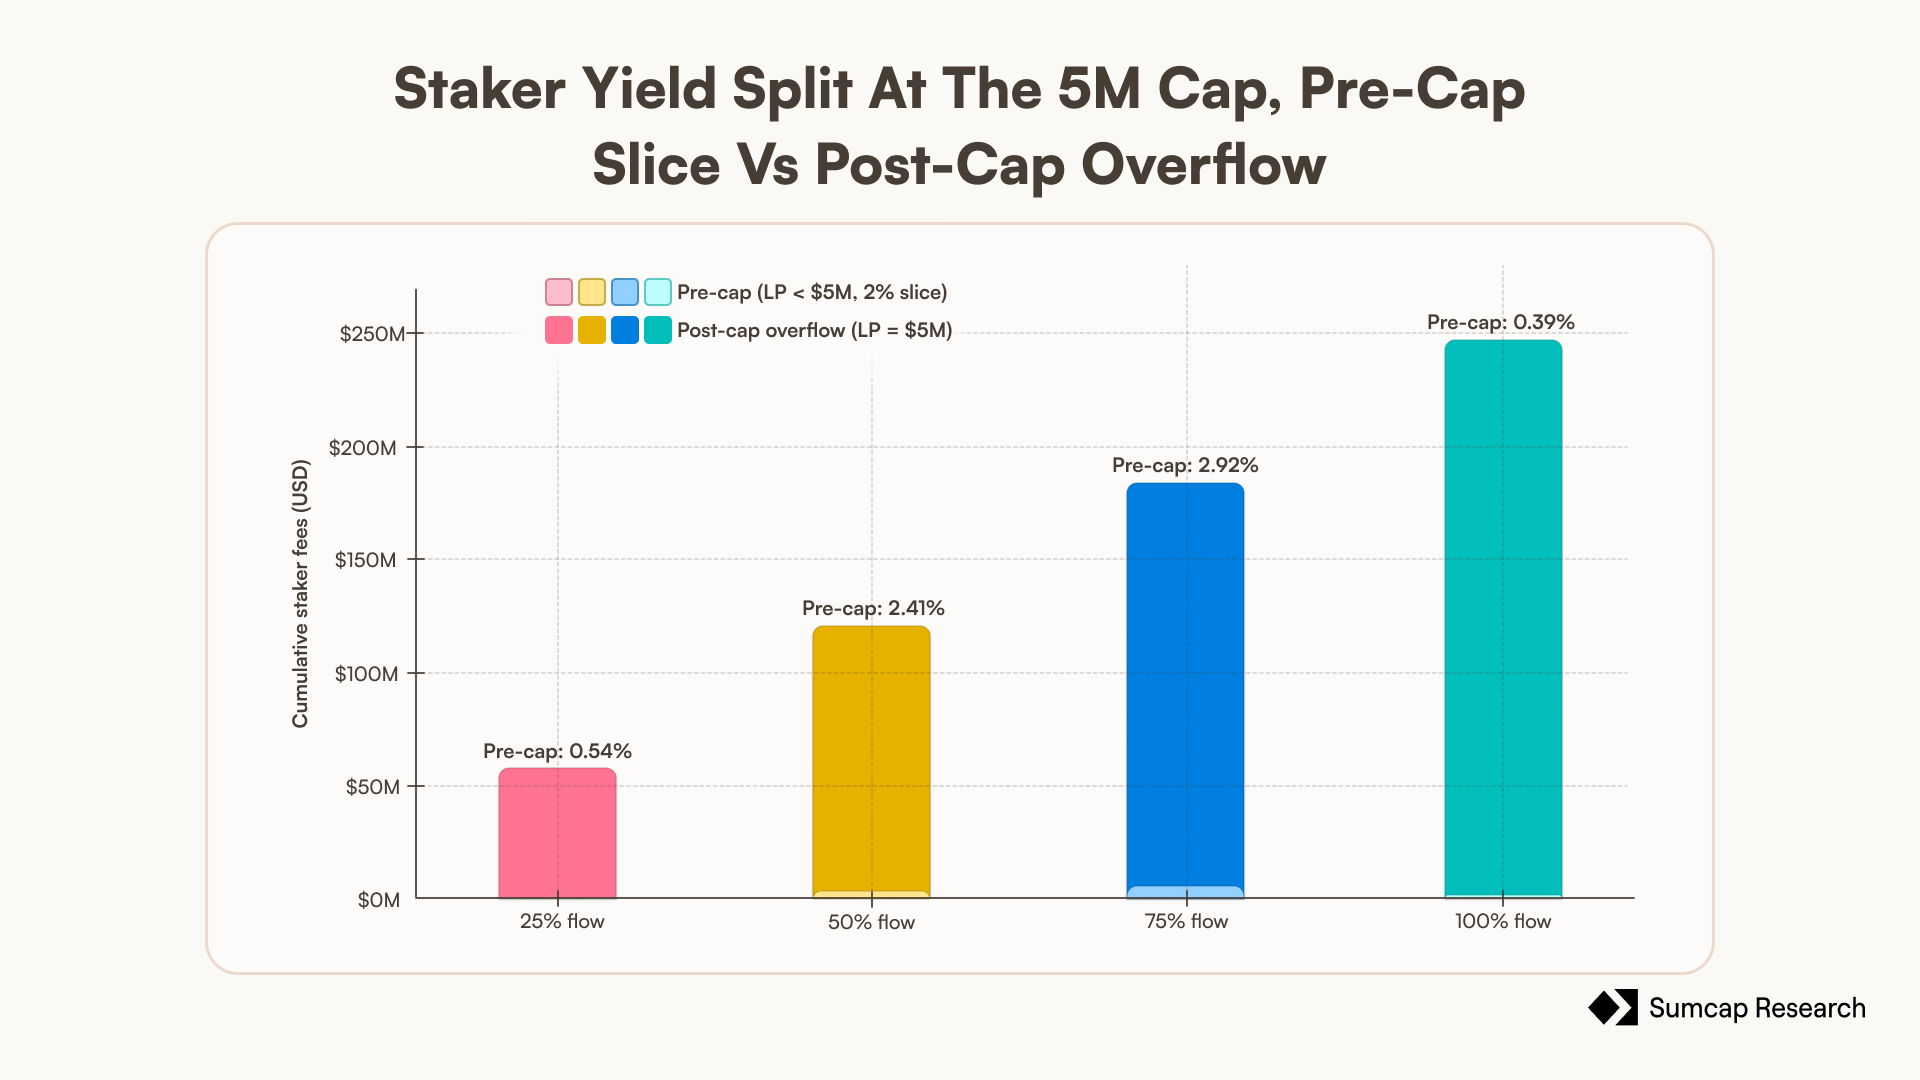
Figure 6 - Staker yield split at the $5M cap, the pre-cap slice versus the post-cap overflow, by flow

The value above each bar shows how much of total fees came from the pre-cap slice, before the LP reached the $5M cap. The ordering is not monotone in flow, because pre-cap fees are driven by volume × time below the cap and by which specific trading days happen to land inside that window. Either way the number never clears three per cent, which means that no flow level makes the pre-cap regime matter.

Daily minting peaks in the first days while cumulative staker fees are still flat near zero, and the fee line only starts to climb after the $5M crossing.
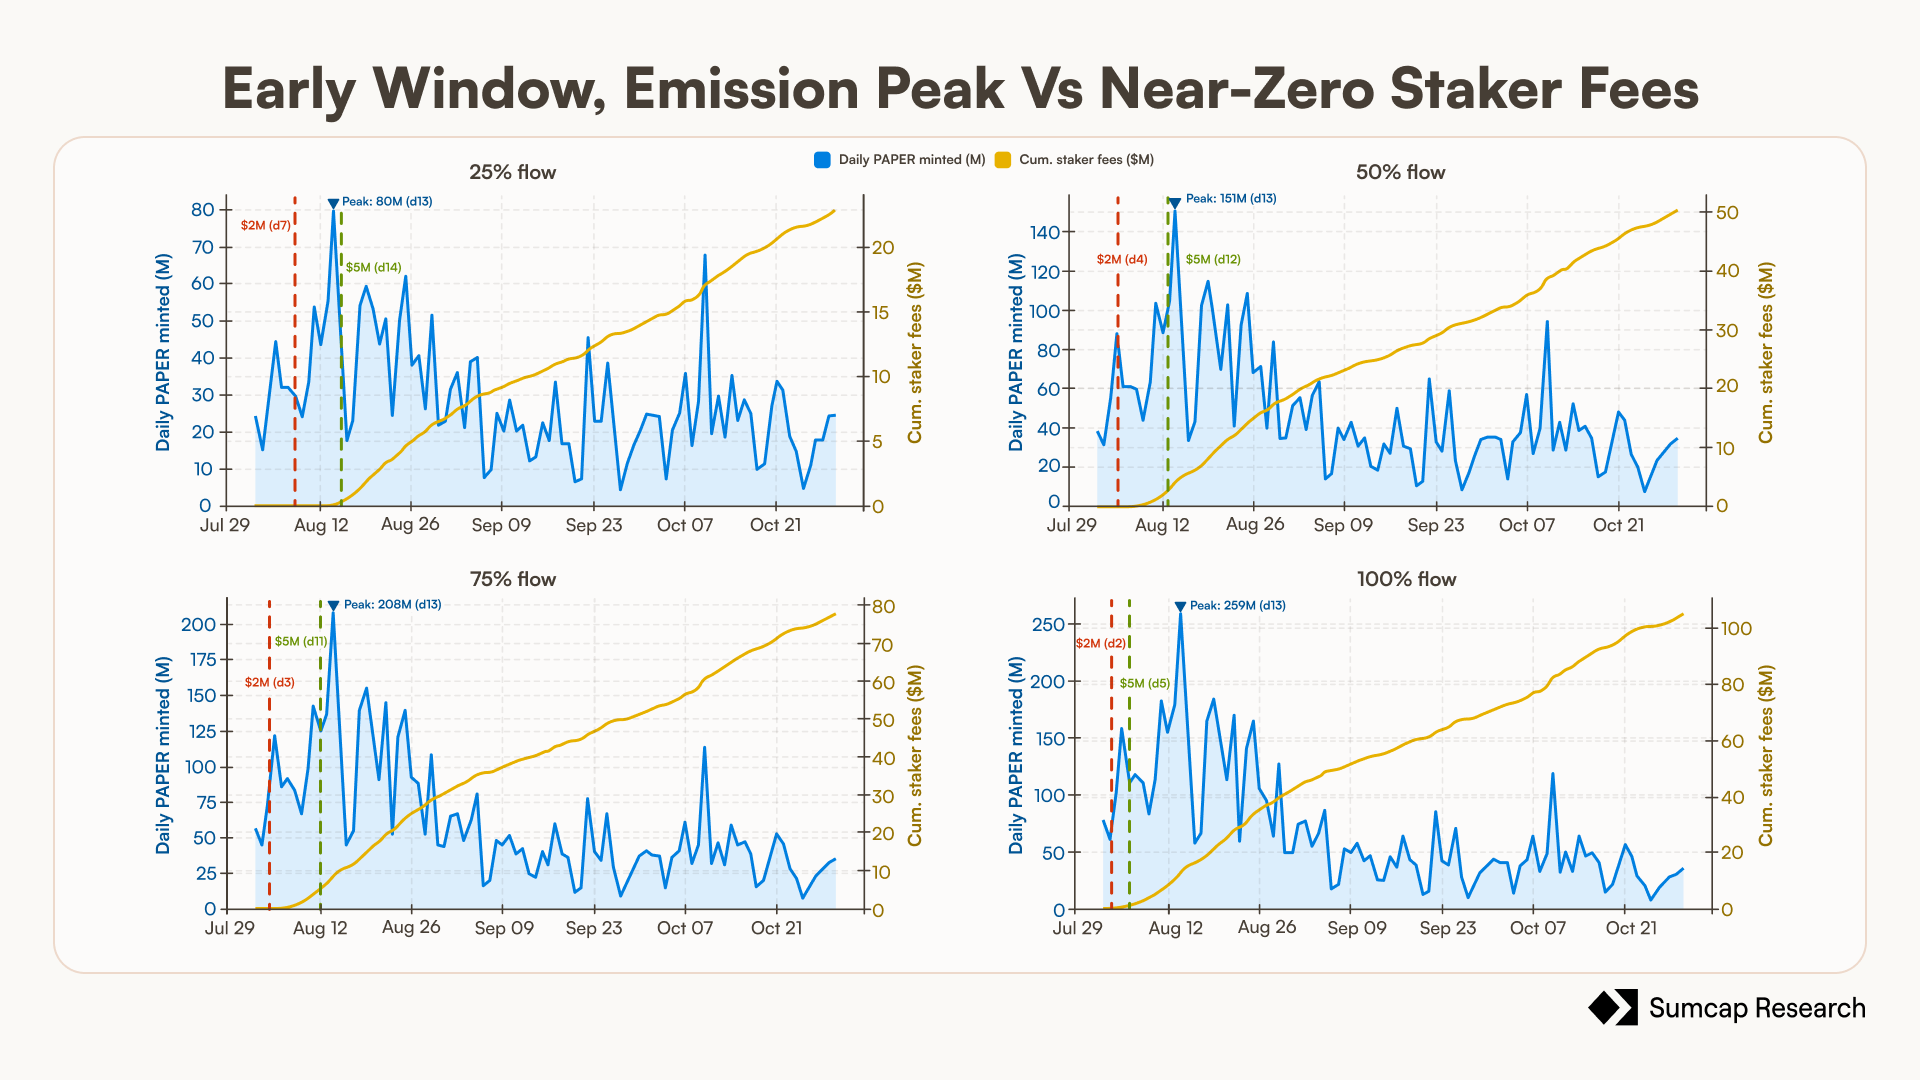
Figure 7 - Zoom on the early window, the emission rate at its peak against near-zero staker fees, with the $2M and $5M crossings marked

Peak daily emissions do not necessarily occur before the $2M threshold. In these charts, daily $PAPER minted is the product of the mint rate per dollar and the loss volume processed that day. Once the LP moves above $2M, the rate begins to decay, but if trader losses continue to grow, the larger volume can more than offset the lower rate. At every flow level the single biggest minting day is day 13 (79.7M $PAPER at a quarter of flow, rising to 258.8M at full flow), even though the $2M decay threshold was crossed as early as day 2 at full flow and day 7 at a quarter.

In short, volume can dominate rate, so the emission peak is determined by their interaction rather than by the rate curve alone.

3. What a day-0 staker collects

The dividend per token above is measured against the final supply, which flatters nobody and describes nobody. A holder who mints at the floor and never adds owns their tokens against a much smaller supply for most of the window, and collects every fee that arrives in between at that smaller denominator.

So we value each day's fees against the supply outstanding on that day rather than at the end. Because supply is minted fastest at the start and then flattens while fees keep arriving, the early fees land while the denominator is still small, and a day-0 staker ends the window 85% ahead of what the naive fees-over-final-supply figure implies. That gap is the whole of the front-loading advantage, expressed in dollars. We compute that series and the payback, the point at which cumulative fees per token cross the one-cent mint cost once, and then several times over.
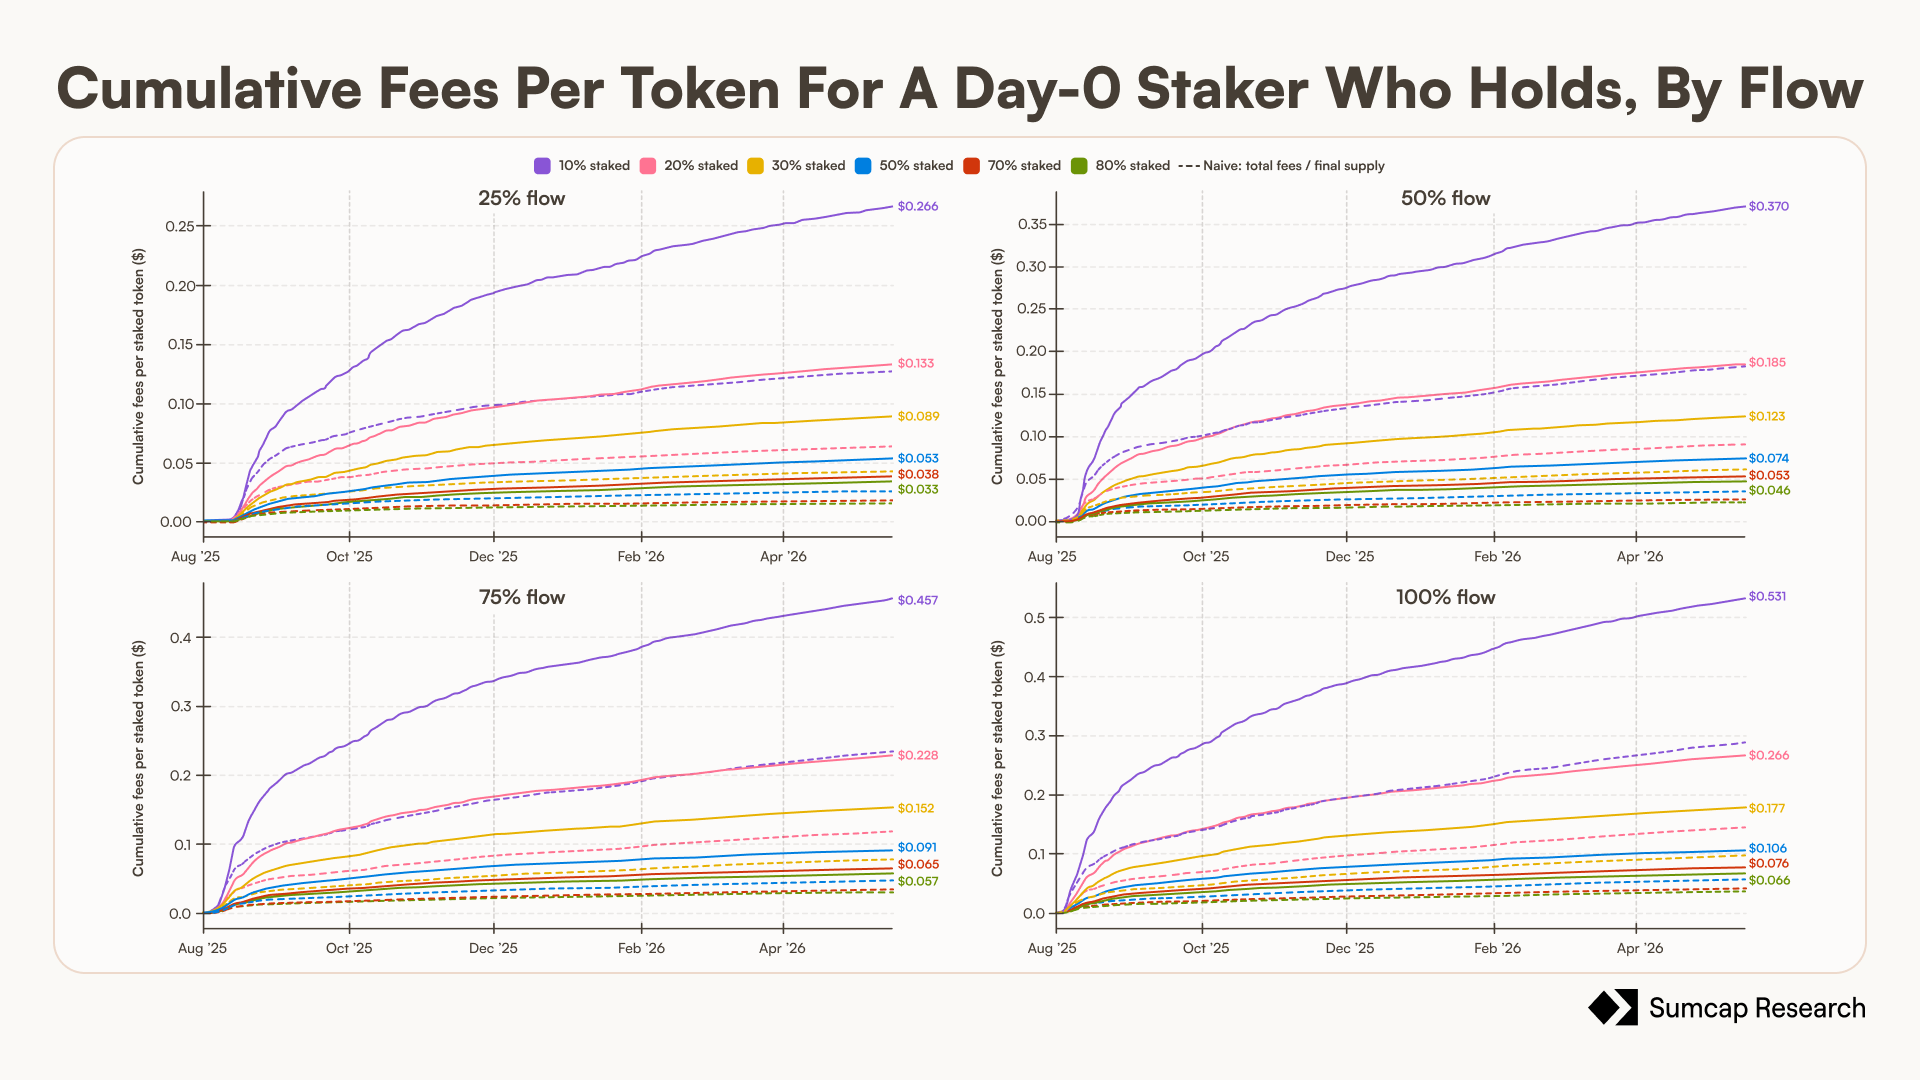
Figure 8 - Cumulative fees per token for a day-0 staker who holds, by flow

The payback runs from about 3.3x in the least favourable case (80% staked at a quarter of flow) to 53.1x in the most favourable (10% staked at full flow), sitting near 26.6x for the central 20%-staked, full-flow case. In fee terms alone, before any move in the token price, an early loser who stakes recovers the loss many times over, and the break-even is crossed within the first weeks. Participation is the only lever that moves the multiple materially, which is why the bands fan out by staked share rather than by flow.
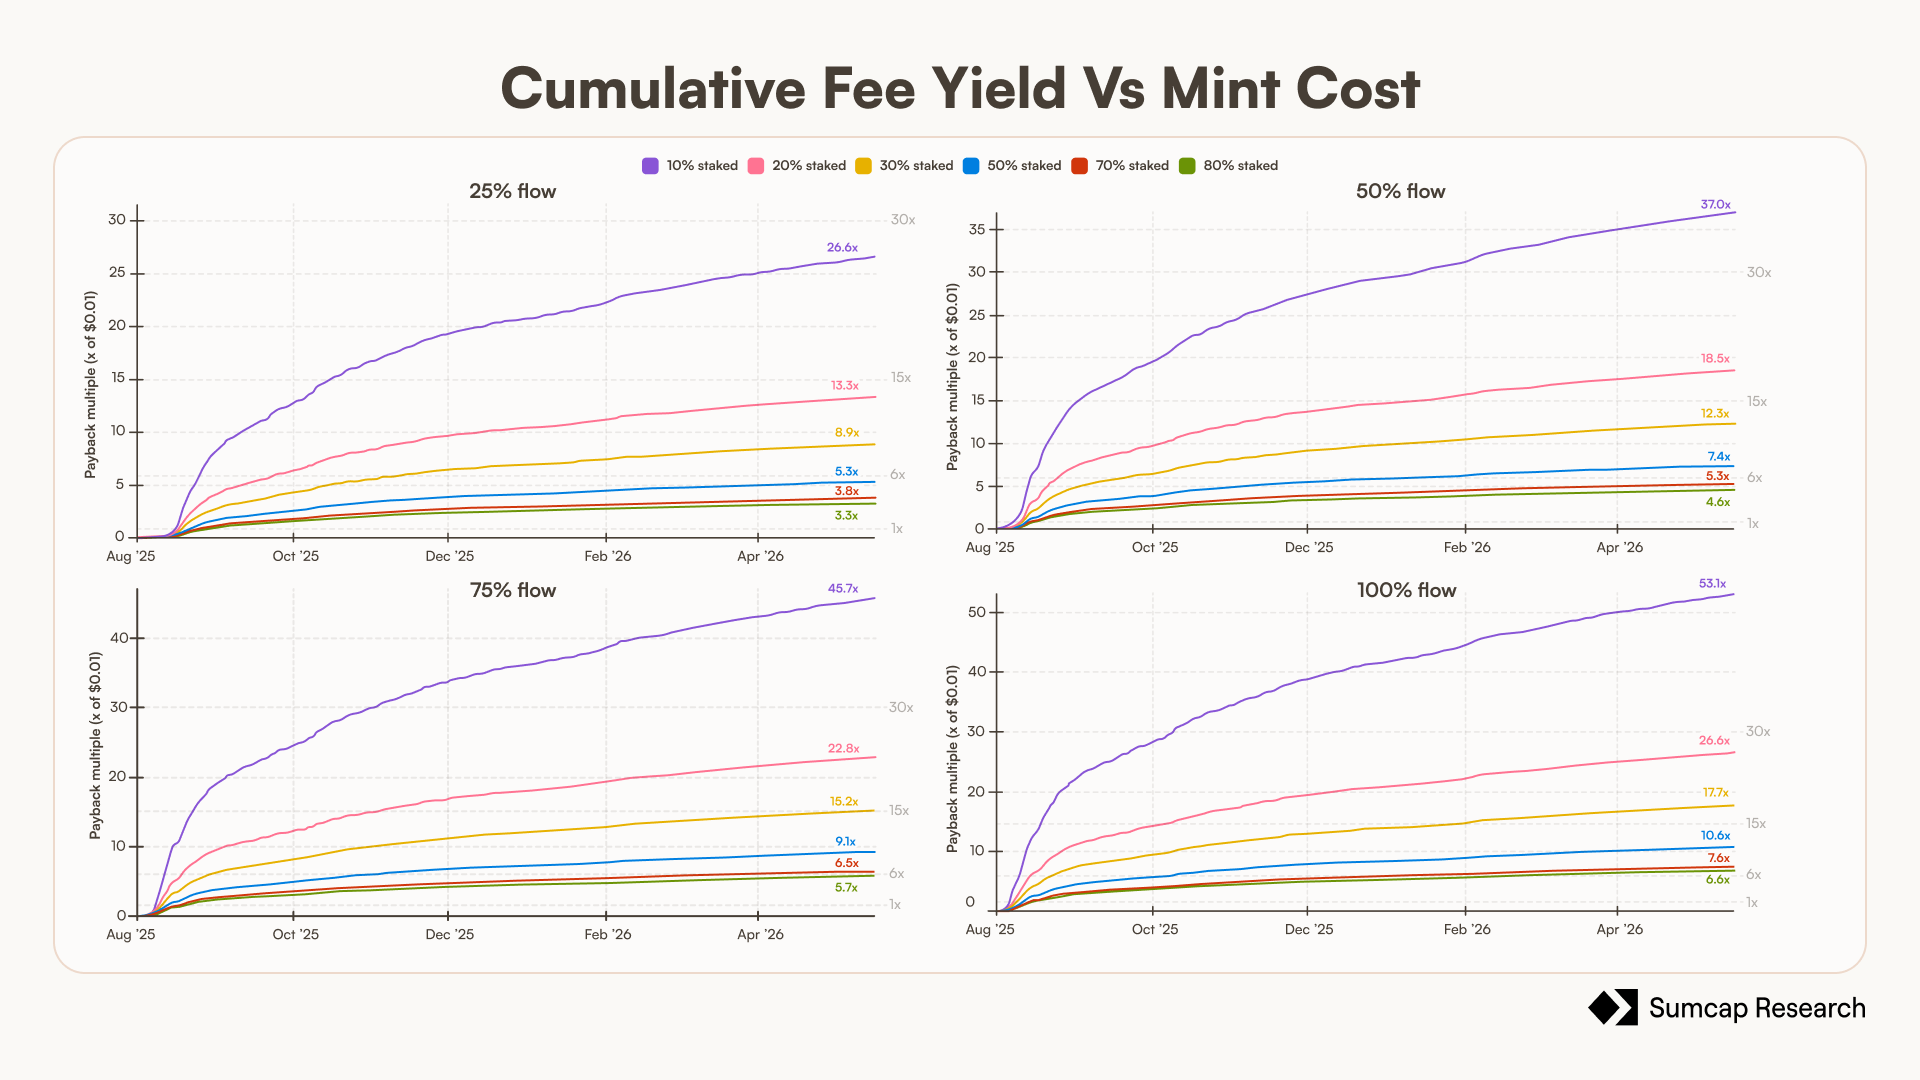
Figure 9 - Cumulative fee yield versus the original loss, payback in multiples of the one-cent floor

4. Who captures the stream, cohort analysis

The whole point of the front-loaded emission is that the earliest losers mint the most tokens at the lowest cost, so the fee stream that arrives later lands disproportionately on them. Cutting the population by entry day makes this concrete: lifetime yield per dollar lost should fall with the day a cohort arrives, because arriving earlier means a cheaper mint and a larger token count against the same future fees.

The stronger version of the claim is concentration. If we ask what share of all staker fees over the window accrues to the first 5%, 10%, or 25% of losers to arrive, we see a heavily front-loaded curve, which implies a heavily concentrated payout, where a small early cohort captures most of the stream.

The decay with entry day is steep and convex. At full flow and 20% staked the day-0 cohort earns $0.266 per token, the day-30 cohort $0.157, day-90 $0.095, and day-180 $0.046, so roughly 40% of the lifetime advantage is gone within the first month, and the day-0 cohort ends up earning about six times what the day-180 cohort does. Part of that decline is the window closing rather than the mechanism working (a cohort arriving on day 270 has only twenty days of fees left to collect), but the drop through the first ninety days, where hundreds of days of fees still lie ahead of every cohort, is the front-loading itself.

Additionally, earlier cohorts mint more tokens per dollar lost, and they then hold those tokens against a smaller supply, so they capture a larger share of every fee that arrives afterwards. The staked-fraction lines are parallel. Participation scales the level of the curve but not its timing, because arriving early is worth the same proportionally whether the pool is crowded or not.
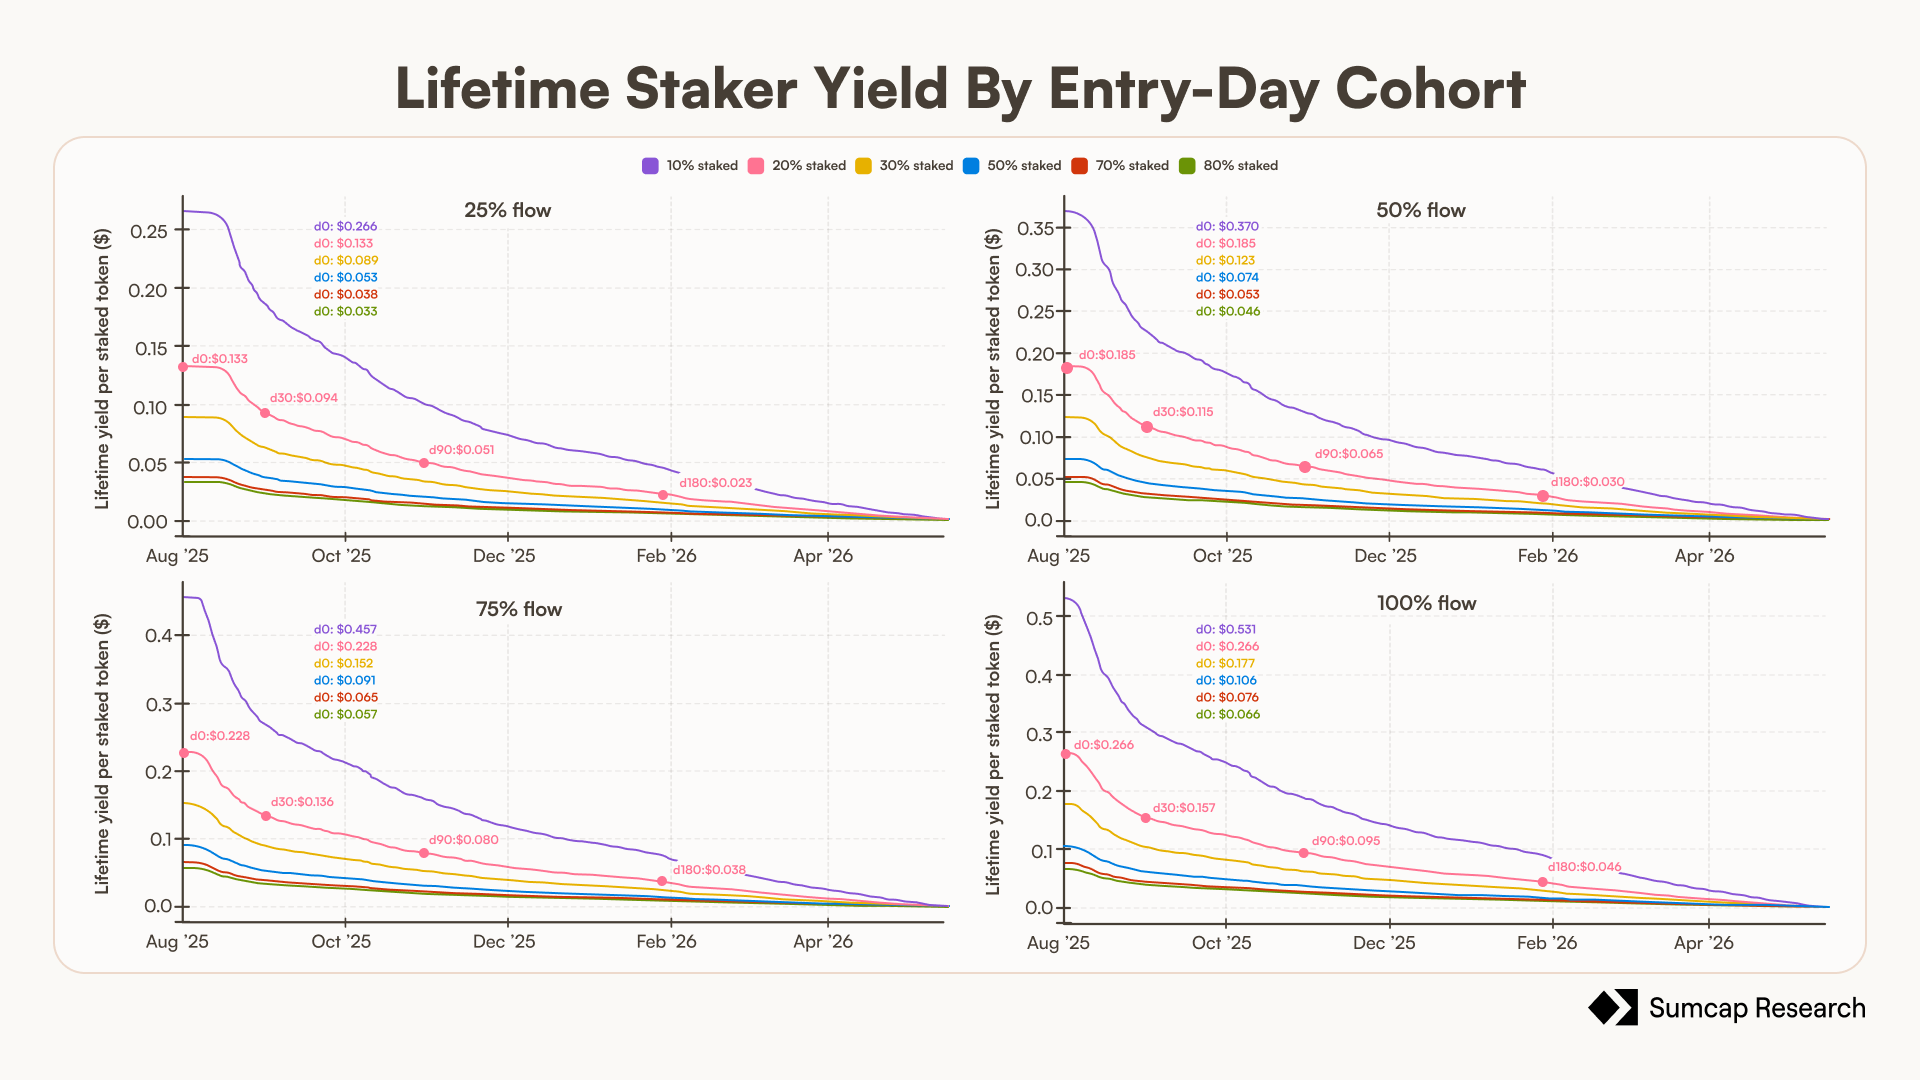
Figure 10 - Lifetime staker yield by entry-day cohort

The first 5% of losers capture 39% of all staker fees, the first 10% capture 62.7%, and the first 25% capture 85.4%, so the first quarter of arrivals earns more than four fifths of the entire stream.
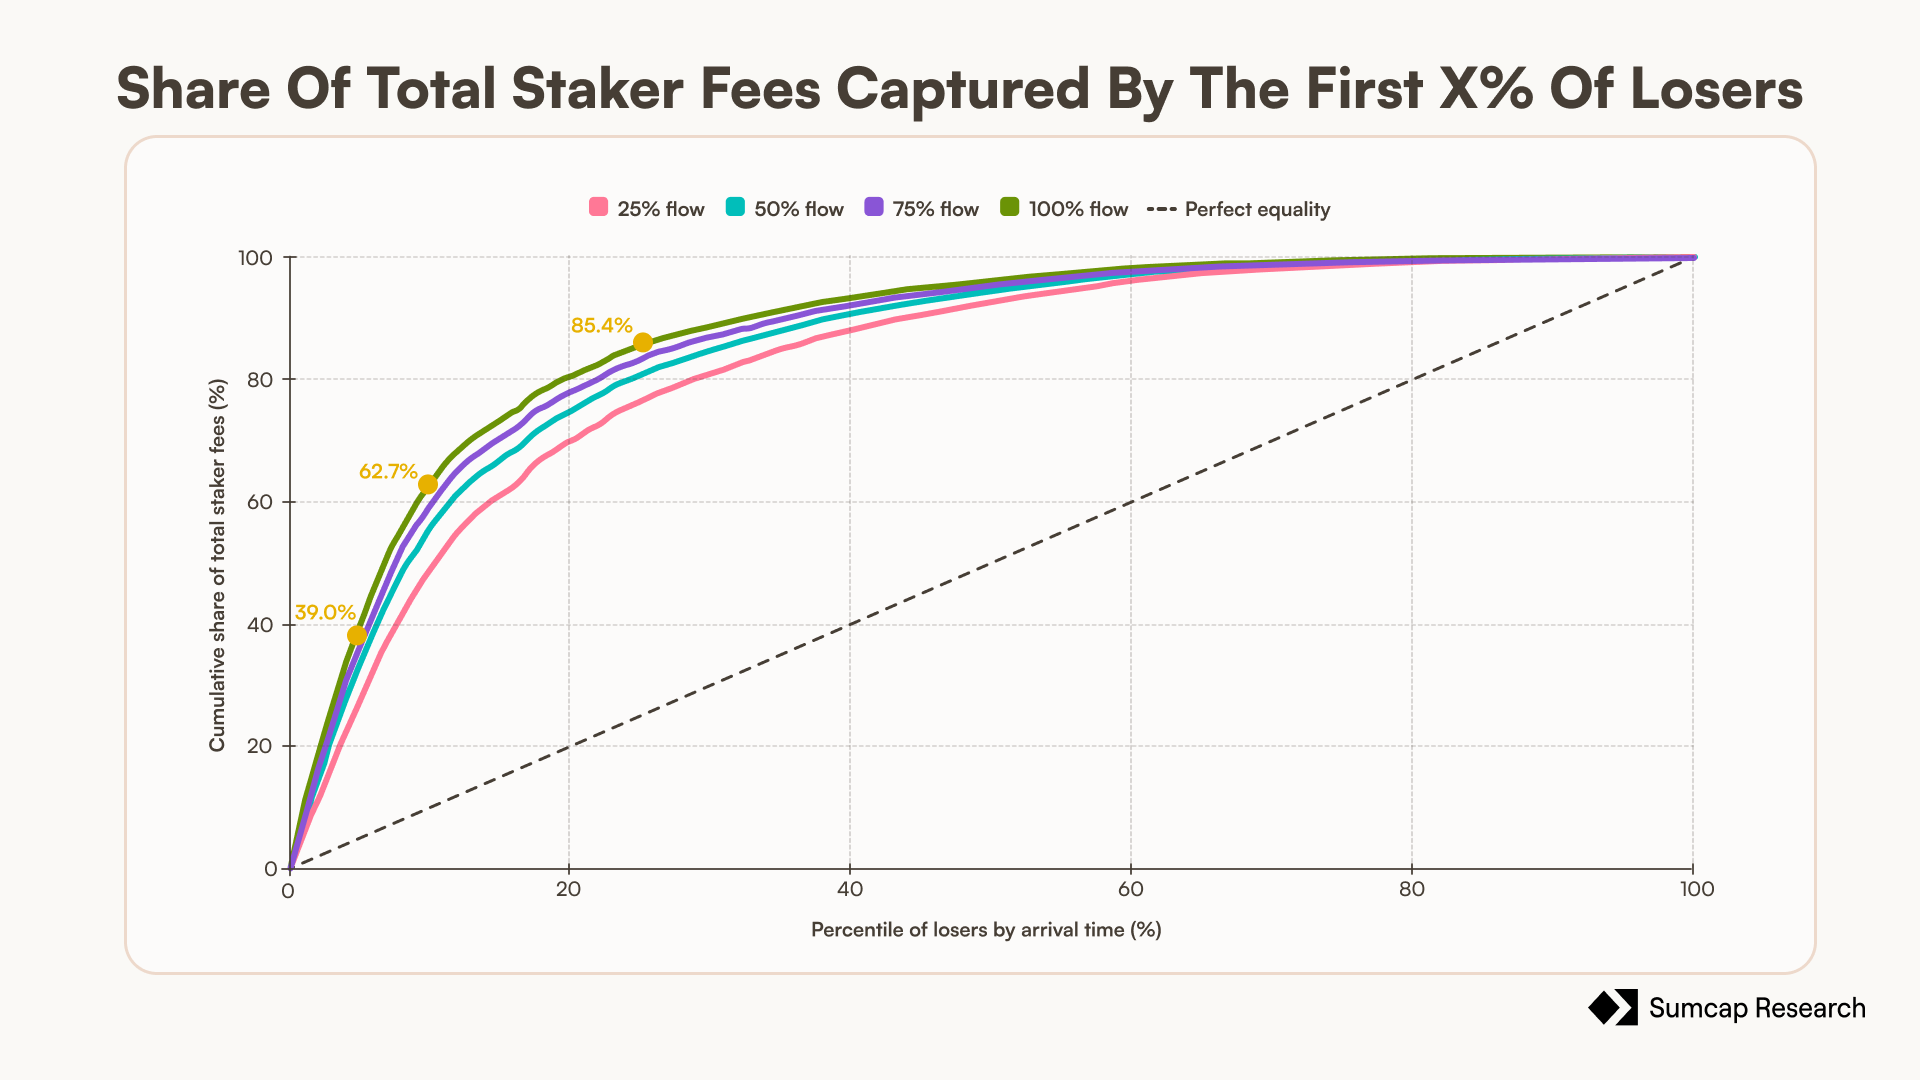
Figure 11 - Share of total staker fees captured by the first X% of losers to arrive

5. Valuation and the staking decision

The cumulative dollar figures and the multiple-of-mint-cost are price-free, but a percentage yield is not: it needs a token price. Rather than assume one, we invert the problem and let valuation be the output.

5.1 Equilibrium at target yields

A rational staker stakes until the dividend yield falls to the return they require, so the equilibrium is defined by the yield itself. We fix a grid of target annualised dividend yields, 10%, 20%, 30%, 40% and 50%, and for each one back out the valuation the fee stream can support. Those yields may look high, but LLP (Lighter's liquidity pool) paid more than 100% APY in its early months, while the pool was still small, and although part of that came from market making, a large share came from the liquidation fees the pool collected, the same loss-driven flow that funds Papertrade.

To calculate the valuation we lean on one fact: the fees are paid in USDC and their size is set by trader losses, so the dividend stream is fixed in dollars.

This means that the implied price per $PAPER is the following:

$$P = \frac{F}{Y \cdot s \cdot N}$$

where s is the staked share (fraction of total supply), N the total supply and Y the yield.

This is not a price prediction. It states the valuation the fee stream would justify only if the market prices the token purely as a dividend. It assumes the run-rate is sustained, so if flow contracts under the emission model every figure scales down in proportion.

Figure 12 - Equilibrium at target yields, implied valuation and price per token for 10 to 50% annualised, versus the mint cost

The run-rate behind the grid spans $0.034 per staked token per year in the least generous cell (50% staked at a quarter of flow) to $0.184 in the most generous (20% staked at full flow). Because the return is a transfer from later losers to earlier stakers, it lasts only as long as new losers keep arriving. That makes it a risky and potentially self-terminating cash flow, the kind a market prices at a high yield rather than a bond-like one. At a required yield of 50% or more, the implied price at full flow sits between about $0.15 and $0.37 depending on the staked share, falling to roughly $0.07 to $0.17 at a quarter of flow, and lower still if the market demands more.

5.2 DCF and NPV per token

The equilibrium view asks what the market would have to pay. The DCF (Discounted Cash Flow) view asks what the claim is intrinsically worth. Treating a staked token as a perpetual claim on its share of the fee stream, its NPV (Net Present Value) is the discounted sum of future fees per token. Because the fee per token is roughly flat once the supply plateaus, that sum reduces to the annual fee per token divided by the discount rate, which is what the figure reports across a grid of discount rates.

The comparison that matters is the mint cost: an early loser paid a cent of realised loss for a claim that the discounted cash flow values at between roughly 4 and 90 times that cent, depending on flow, staking and the discount rate, and never below it. That is the cleanest statement of why losing early can be rational, and the DCF reaches it without invoking a market price.
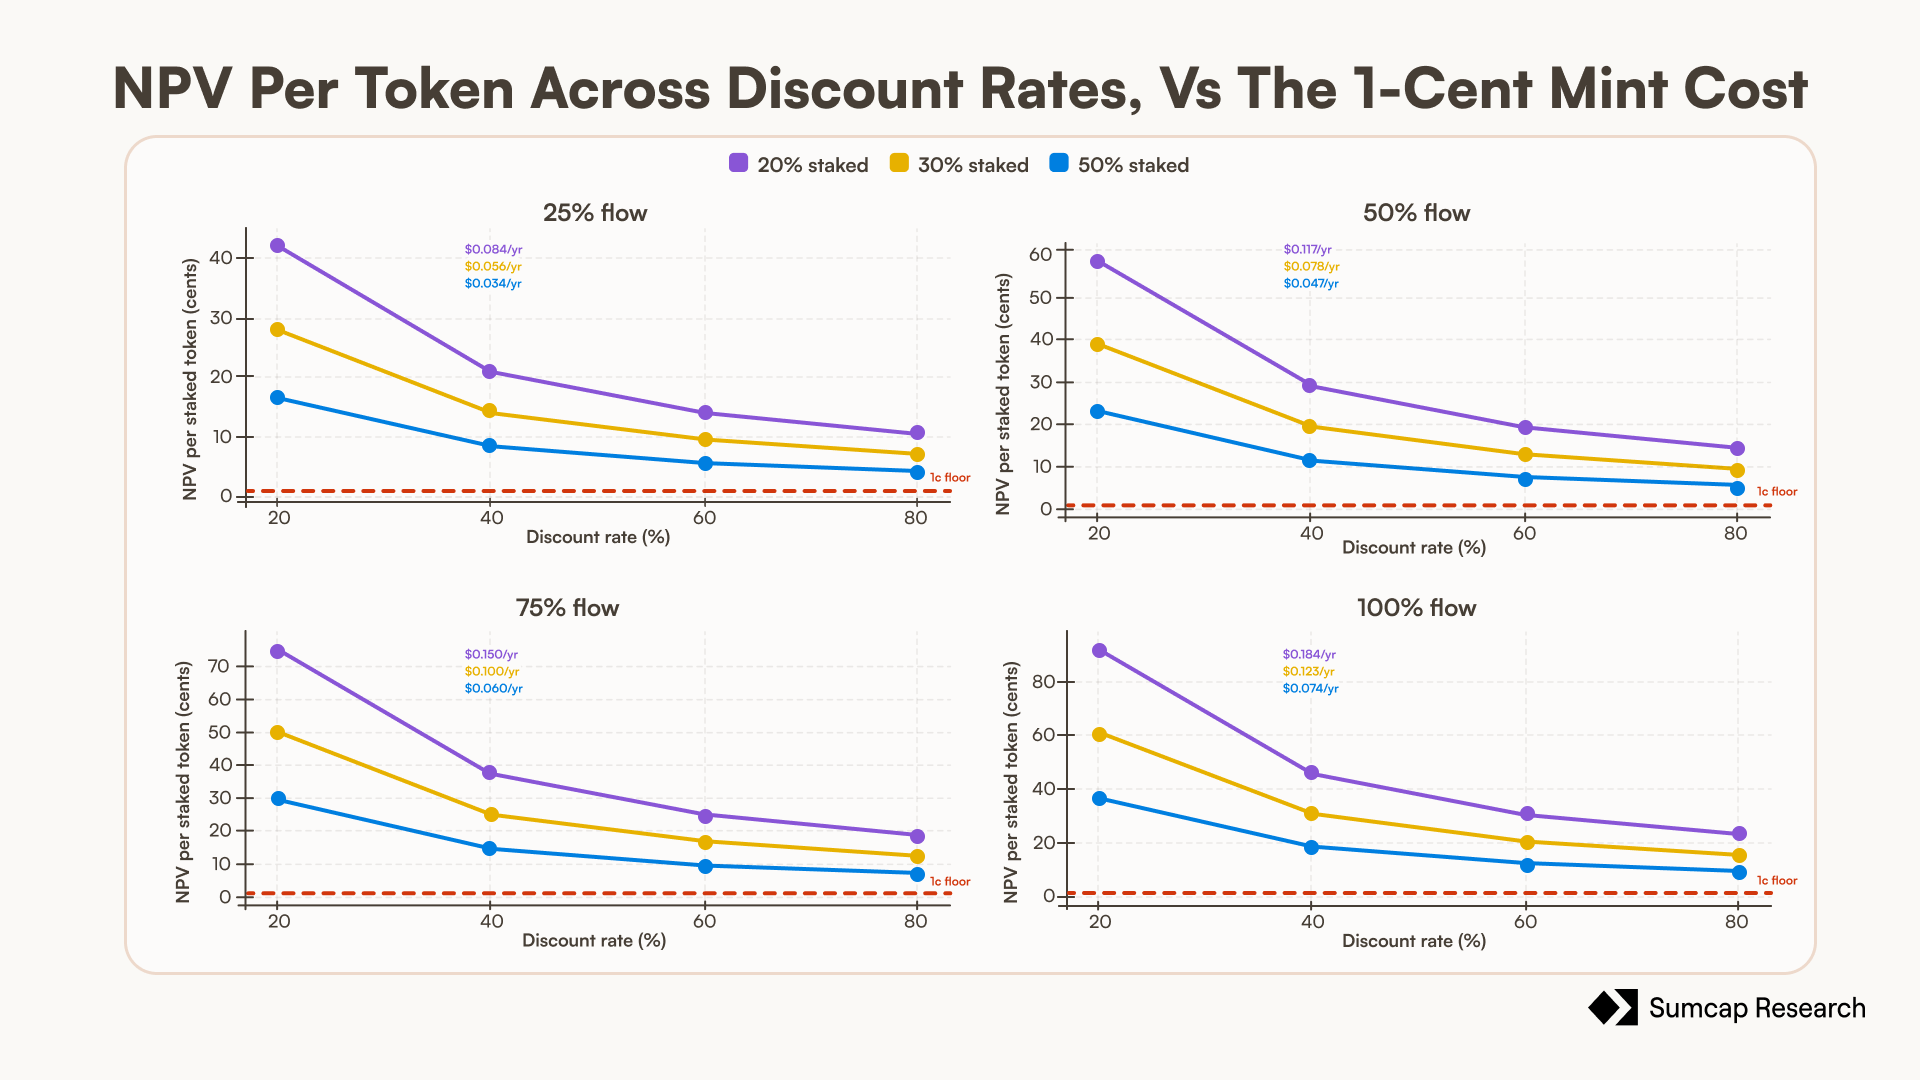
Figure 13 - NPV per token across discount rates, versus the one-cent mint cost

Even at an 80% discount rate and 25% of flow, the token is still worth between about 4 and 11 cents and it never approaches the one-cent mint cost anywhere in the grid.

6. Conclusions

The token carries a real, heavily front-loaded claim on protocol revenue, and for the earliest cohort that claim repays the original loss many times over. The flywheel works while new losers keep arriving, because their losses both fill the cap and pay the stakers who funded it first, and the same loss that is a cash cost is a token asset.

Three conditions keep the bullish reading honest. The yield only materialises for someone who actually stakes and holds rather than selling on day one. The dollar figures describe protocol revenue, not the market price of $PAPER, which is what a holder ultimately lives or dies on. And the entire return is a transfer from later losers to earlier stakers, so it lasts exactly as long as new losers keep arriving.

With those stated, the picture is favourable for the right participant, the one who understands the mechanism, shows up first, loses on purpose, and stakes the proceeds.

September 15, 2026

The Token Economics of Papertrade

Papertrade, Tokenomics, Perps, DeFi

We proved the mechanism holds, but the harder question is whether $PAPER gives anyone a reason to keep it turning.

September 15, 2026

Introduction

The first piece settled that Papertrade is mechanically resilient, and that a pool seeded at zero and funded only by trader losses stays solvent at 1000x under all 608 scenarios we ran on a Rollbit-based impact curve. But that study did not answer whether their token is economically viable and attractive.

Papertrade can be mechanically sound and still fail economically if nobody has a durable reason to keep trading, holding, and staking the token that bootstraps it. Papertrade pays its losing traders in $PAPER, and the whole flywheel rests on its value. So this piece asks a different thing: does $PAPER create incentives strong enough to keep the flywheel turning?

Briefly, the mechanic we are pricing. Every dollar of trader loss mints $PAPER, whether or not the LP is at its cap, at a flat 100 per dollar while cumulative LP gains are under $2M and along a decaying tail after that. While the LP is still filling toward its $5M cap, a 2% protocol fee is peeled off each dollar of income (1% to $PAPER stakers, 1% to the frontend) and the other 98% grows the pool. So minting tracks total trader losses, and the cap only decides whether each dollar grows the pool or pays the stakers, never whether it mints.

This piece builds directly on the first and does not repeat its groundwork. How Papertrade works, how simulations are run, the assumptions behind them, and their limitations are all set out in the first article. The full simulation code is available at https://github.com/HakaiRhinohl/PaperTrade-Simulations.

1. Emission schedule and inflation pressure

Every $PAPER that will ever exist is minted by a loss, and the schedule is steep at the start and flat at the end. Total supply runs from about 4.6 billion at a quarter of Hyperliquid's volume to about 8.6 billion, and roughly 3.7 to 6.4 billion under the pessimistic volume model.

Figure 1 - Cumulative $PAPER supply and staker fees over time, by flow

The issuance is heavily front-loaded. At full flow, launching on day 0, 43.6% of all the $PAPER that will ever be minted is minted before the marginal cost doubles off the floor, which happens on day 30, and 72.6% is minted inside the first 90 days. The mechanism is the squared decay term in the emission rate, which drops fast once the LP clears $2M and never recovers because it tracks a high-water mark; the cost doubles once that tail high-water mark reaches $49.7M of cumulative gain.

Figure 2 - How front-loaded emission is, the share of $PAPER minted early and how fast

The marginal cost starts at the one-cent floor and climbs with flow: by the end of the window it sits near 2.5 cents at a quarter of flow, 4.7 at half, 7.6 at three quarters and about 11 cents at full flow. Averaged over the whole run it goes from 1.5 cents at a quarter of flow to 3.3 at full flow.

Figure 3 - Marginal cost to mint one $PAPER over the life of the pool, by flow

Inflation is highest when the pool is most fragile to incentivise traders, while the LP is under $2M and the rate is pinned at 100 $PAPER per dollar ($0.01 per $PAPER), and it decays toward zero as the supply curve flattens. A token earned late faces much less dilution than a token earned at the floor when the inflation was the highest. Expressing emission as a periodic inflation rate (new $PAPER over circulating $PAPER) makes that trade explicit and sets up the real-yield question in section 3.

The rate spikes past 10,000% annualised in the opening days, then collapses as the supply base grows. It settles to a final annualised rate that is lower the higher the flow, from 54.0% at a quarter of flow down to 23.4% at full flow.

Figure 4 - $PAPER inflation rate over time, new tokens as a share of circulating supply, by flow

Annualised inflation is highly sensitive to the initial supply base. The early spike reflects issuance occurring while circulating supply was still very small, so it should not be interpreted as a sustainable forward rate. As supply scales, the annualised rate normalises quickly, falling from extreme early readings to a few hundred percent within the first few months and to roughly 24 to 54% by the end of the period depending on the flow assumption.

2. Fee generation and the dividend per $PAPER

Cumulative staker fees over the window run from about $59M at a quarter of Hyperliquid's volume to about $248M at full flow in the base model, and roughly $41M to $112M under the pessimistic model.

Figure 5 - Cumulative staker fees by flow, base versus emission-based volume

The dividend per token is the fee stream divided by the staked supply, and its shape is the key result of this piece. Supply is front-loaded and flattens but fees arrive at a roughly constant rate across the whole window. So the cumulative dividend per token climbs while the supply curve plateaus, which means the payout per token improves over time. An early loser captures a front-loaded share of the tokens and then collects on them slowly, as everyone who trades after them keeps losing.

2.1 The two fee regimes, and a zoom before the cap

There are two fee regimes and they are very different. While the LP is filling toward $5M, stakers receive only a 1% slice of protocol income (the frontend takes a matching 1%), with the other 98% going to fill the pool. Once the cap is full, the split flips and 99% of every further dollar of trader losses goes to stakers. Since the pool fills in 5 to 14 days depending on flow, the pre-cap regime is only a couple of weeks long at most, so the pre-cap dividend per token is close to negligible.

What makes that worth a closer look is what emission is doing at the very same time. The pre-cap window is exactly when the emission rate is at its maximum. The two curves move in opposite directions across that opening window. Whoever mints there buys the largest and cheapest claim on the protocol precisely when that claim is paying almost nothing, and is repaid only later, once the cap is full and the entire loss stream routes to stakers. Splitting the fees at the cap shows how lopsided the two regimes are, and zooming the early window puts the peak of emission and the trough of fees on the same axis so the mismatch is visible directly.

The pre-cap window accounts for between 0.4% and 2.9% of the lifetime protocol fee stream depending on flow. Essentially the entire dividend is a post-cap phenomenon.

Figure 6 - Staker yield split at the $5M cap, the pre-cap slice versus the post-cap overflow, by flow

The value above each bar shows how much of total fees came from the pre-cap slice, before the LP reached the $5M cap. The ordering is not monotone in flow, because pre-cap fees are driven by volume × time below the cap and by which specific trading days happen to land inside that window. Either way the number never clears three per cent, which means that no flow level makes the pre-cap regime matter.

Daily minting peaks in the first days while cumulative staker fees are still flat near zero, and the fee line only starts to climb after the $5M crossing.

Figure 7 - Zoom on the early window, the emission rate at its peak against near-zero staker fees, with the $2M and $5M crossings marked

Peak daily emissions do not necessarily occur before the $2M threshold. In these charts, daily $PAPER minted is the product of the mint rate per dollar and the loss volume processed that day. Once the LP moves above $2M, the rate begins to decay, but if trader losses continue to grow, the larger volume can more than offset the lower rate. At every flow level the single biggest minting day is day 13 (79.7M $PAPER at a quarter of flow, rising to 258.8M at full flow), even though the $2M decay threshold was crossed as early as day 2 at full flow and day 7 at a quarter.

In short, volume can dominate rate, so the emission peak is determined by their interaction rather than by the rate curve alone.

3. What a day-0 staker collects

The dividend per token above is measured against the final supply, which flatters nobody and describes nobody. A holder who mints at the floor and never adds owns their tokens against a much smaller supply for most of the window, and collects every fee that arrives in between at that smaller denominator.

So we value each day's fees against the supply outstanding on that day rather than at the end. Because supply is minted fastest at the start and then flattens while fees keep arriving, the early fees land while the denominator is still small, and a day-0 staker ends the window 85% ahead of what the naive fees-over-final-supply figure implies. That gap is the whole of the front-loading advantage, expressed in dollars. We compute that series and the payback, the point at which cumulative fees per token cross the one-cent mint cost once, and then several times over.

Figure 8 - Cumulative fees per token for a day-0 staker who holds, by flow

The payback runs from about 3.3x in the least favourable case (80% staked at a quarter of flow) to 53.1x in the most favourable (10% staked at full flow), sitting near 26.6x for the central 20%-staked, full-flow case. In fee terms alone, before any move in the token price, an early loser who stakes recovers the loss many times over, and the break-even is crossed within the first weeks. Participation is the only lever that moves the multiple materially, which is why the bands fan out by staked share rather than by flow.

Figure 9 - Cumulative fee yield versus the original loss, payback in multiples of the one-cent floor

4. Who captures the stream, cohort analysis

The whole point of the front-loaded emission is that the earliest losers mint the most tokens at the lowest cost, so the fee stream that arrives later lands disproportionately on them. Cutting the population by entry day makes this concrete: lifetime yield per dollar lost should fall with the day a cohort arrives, because arriving earlier means a cheaper mint and a larger token count against the same future fees.

The stronger version of the claim is concentration. If we ask what share of all staker fees over the window accrues to the first 5%, 10%, or 25% of losers to arrive, we see a heavily front-loaded curve, which implies a heavily concentrated payout, where a small early cohort captures most of the stream.

The decay with entry day is steep and convex. At full flow and 20% staked the day-0 cohort earns $0.266 per token, the day-30 cohort $0.157, day-90 $0.095, and day-180 $0.046, so roughly 40% of the lifetime advantage is gone within the first month, and the day-0 cohort ends up earning about six times what the day-180 cohort does. Part of that decline is the window closing rather than the mechanism working (a cohort arriving on day 270 has only twenty days of fees left to collect), but the drop through the first ninety days, where hundreds of days of fees still lie ahead of every cohort, is the front-loading itself.

Additionally, earlier cohorts mint more tokens per dollar lost, and they then hold those tokens against a smaller supply, so they capture a larger share of every fee that arrives afterwards. The staked-fraction lines are parallel. Participation scales the level of the curve but not its timing, because arriving early is worth the same proportionally whether the pool is crowded or not.

Figure 10 - Lifetime staker yield by entry-day cohort

The first 5% of losers capture 39% of all staker fees, the first 10% capture 62.7%, and the first 25% capture 85.4%, so the first quarter of arrivals earns more than four fifths of the entire stream.

Figure 11 - Share of total staker fees captured by the first X% of losers to arrive

5. Valuation and the staking decision

The cumulative dollar figures and the multiple-of-mint-cost are price-free, but a percentage yield is not: it needs a token price. Rather than assume one, we invert the problem and let valuation be the output.

5.1 Equilibrium at target yields

A rational staker stakes until the dividend yield falls to the return they require, so the equilibrium is defined by the yield itself. We fix a grid of target annualised dividend yields, 10%, 20%, 30%, 40% and 50%, and for each one back out the valuation the fee stream can support. Those yields may look high, but LLP (Lighter's liquidity pool) paid more than 100% APY in its early months, while the pool was still small, and although part of that came from market making, a large share came from the liquidation fees the pool collected, the same loss-driven flow that funds Papertrade.

To calculate the valuation we lean on one fact: the fees are paid in USDC and their size is set by trader losses, so the dividend stream is fixed in dollars.

This means that the implied price per $PAPER is the following:

$$P = \frac{F}{Y \cdot s \cdot N}$$

where s is the staked share (fraction of total supply), N the total supply and Y the yield.

This is not a price prediction. It states the valuation the fee stream would justify only if the market prices the token purely as a dividend. It assumes the run-rate is sustained, so if flow contracts under the emission model every figure scales down in proportion.

Figure 12 - Equilibrium at target yields, implied valuation and price per token for 10 to 50% annualised, versus the mint cost

The run-rate behind the grid spans $0.034 per staked token per year in the least generous cell (50% staked at a quarter of flow) to $0.184 in the most generous (20% staked at full flow). Because the return is a transfer from later losers to earlier stakers, it lasts only as long as new losers keep arriving. That makes it a risky and potentially self-terminating cash flow, the kind a market prices at a high yield rather than a bond-like one. At a required yield of 50% or more, the implied price at full flow sits between about $0.15 and $0.37 depending on the staked share, falling to roughly $0.07 to $0.17 at a quarter of flow, and lower still if the market demands more.

5.2 DCF and NPV per token

The equilibrium view asks what the market would have to pay. The DCF (Discounted Cash Flow) view asks what the claim is intrinsically worth. Treating a staked token as a perpetual claim on its share of the fee stream, its NPV (Net Present Value) is the discounted sum of future fees per token. Because the fee per token is roughly flat once the supply plateaus, that sum reduces to the annual fee per token divided by the discount rate, which is what the figure reports across a grid of discount rates.

The comparison that matters is the mint cost: an early loser paid a cent of realised loss for a claim that the discounted cash flow values at between roughly 4 and 90 times that cent, depending on flow, staking and the discount rate, and never below it. That is the cleanest statement of why losing early can be rational, and the DCF reaches it without invoking a market price.

Figure 13 - NPV per token across discount rates, versus the one-cent mint cost

Even at an 80% discount rate and 25% of flow, the token is still worth between about 4 and 11 cents and it never approaches the one-cent mint cost anywhere in the grid.

6. Conclusions

The token carries a real, heavily front-loaded claim on protocol revenue, and for the earliest cohort that claim repays the original loss many times over. The flywheel works while new losers keep arriving, because their losses both fill the cap and pay the stakers who funded it first, and the same loss that is a cash cost is a token asset.

Three conditions keep the bullish reading honest. The yield only materialises for someone who actually stakes and holds rather than selling on day one. The dollar figures describe protocol revenue, not the market price of $PAPER, which is what a holder ultimately lives or dies on. And the entire return is a transfer from later losers to earlier stakers, so it lasts exactly as long as new losers keep arriving.

With those stated, the picture is favourable for the right participant, the one who understands the mechanism, shows up first, loses on purpose, and stakes the proceeds.

Heading

This is some text inside of a div block.

Lorem ipsum dolor sit amet, consectetur adipiscing elit. Suspendisse varius enim in eros elementum tristique. Duis cursus, mi quis viverra ornare, eros dolor interdum nulla, ut commodo diam libero vitae erat. Aenean faucibus nibh et justo cursus id rutrum lorem imperdiet. Nunc ut sem vitae risus tristique posuere.

Share this article:
LinkedinX
This is some text inside of a div block.

Heading 1

Heading 2

Heading 3

Heading 4

Heading 5
Heading 6

Lorem ipsum dolor sit amet, consectetur adipiscing elit, sed do eiusmod tempor incididunt ut labore et dolore magna aliqua. Ut enim ad minim veniam, quis nostrud exercitation ullamco laboris nisi ut aliquip ex ea commodo consequat. Duis aute irure dolor in reprehenderit in voluptate velit esse cillum dolore eu fugiat nulla pariatur.

Block quote

Ordered list

  1. Item 1
  2. Item 2
  3. Item 3

Unordered list

  • Item A
  • Item B
  • Item C

Text link

Bold text

Emphasis

Superscript

Subscript

This is some text inside of a div block.

Heading

This is some text inside of a div block.

Lorem ipsum dolor sit amet, consectetur adipiscing elit. Suspendisse varius enim in eros elementum tristique. Duis cursus, mi quis viverra ornare, eros dolor interdum nulla, ut commodo diam libero vitae erat. Aenean faucibus nibh et justo cursus id rutrum lorem imperdiet. Nunc ut sem vitae risus tristique posuere.

This is some text inside of a div block.

Heading 1

Heading 2

Heading 3

Heading 4

Heading 5
Heading 6

Lorem ipsum dolor sit amet, consectetur adipiscing elit, sed do eiusmod tempor incididunt ut labore et dolore magna aliqua. Ut enim ad minim veniam, quis nostrud exercitation ullamco laboris nisi ut aliquip ex ea commodo consequat. Duis aute irure dolor in reprehenderit in voluptate velit esse cillum dolore eu fugiat nulla pariatur.

Block quote

Ordered list

  1. Item 1
  2. Item 2
  3. Item 3

Unordered list

  • Item A
  • Item B
  • Item C

Text link

Bold text

Emphasis

Superscript

Subscript

Read our latest articles

No items found.
No items found.